Nigerian vs Immigrants from Switzerland Bachelor's Degree
COMPARE
Nigerian
Immigrants from Switzerland
Bachelor's Degree
Bachelor's Degree Comparison
Nigerians
Immigrants from Switzerland
37.2%
BACHELOR'S DEGREE
33.9/ 100
METRIC RATING
191st/ 347
METRIC RANK
47.1%
BACHELOR'S DEGREE
100.0/ 100
METRIC RATING
20th/ 347
METRIC RANK
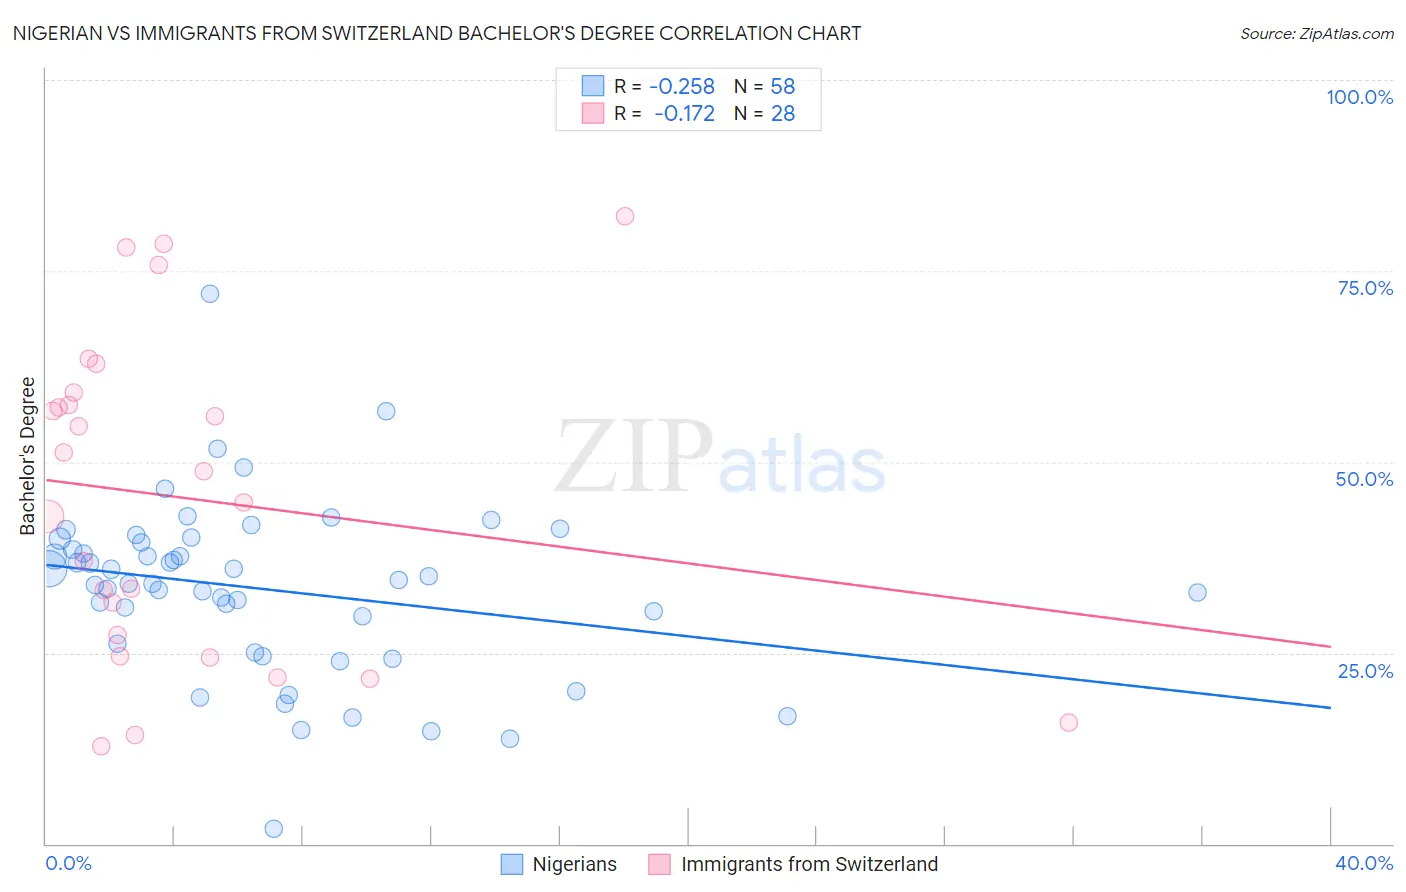
Nigerian vs Immigrants from Switzerland Bachelor's Degree Correlation Chart
The statistical analysis conducted on geographies consisting of 332,744,449 people shows a weak negative correlation between the proportion of Nigerians and percentage of population with at least bachelor's degree education in the United States with a correlation coefficient (R) of -0.258 and weighted average of 37.2%. Similarly, the statistical analysis conducted on geographies consisting of 148,083,391 people shows a poor negative correlation between the proportion of Immigrants from Switzerland and percentage of population with at least bachelor's degree education in the United States with a correlation coefficient (R) of -0.172 and weighted average of 47.1%, a difference of 26.7%.
Bachelor's Degree Correlation Summary
| Measurement | Nigerian | Immigrants from Switzerland |
| Minimum | 2.0% | 12.8% |
| Maximum | 72.0% | 82.2% |
| Range | 70.0% | 69.5% |
| Mean | 33.4% | 45.3% |
| Median | 34.3% | 46.7% |
| Interquartile 25% (IQ1) | 26.1% | 26.0% |
| Interquartile 75% (IQ3) | 39.4% | 58.3% |
| Interquartile Range (IQR) | 13.3% | 32.3% |
| Standard Deviation (Sample) | 11.4% | 20.8% |
| Standard Deviation (Population) | 11.3% | 20.4% |
Similar Demographics by Bachelor's Degree
Demographics Similar to Nigerians by Bachelor's Degree
In terms of bachelor's degree, the demographic groups most similar to Nigerians are Swiss (37.2%, a difference of 0.020%), Immigrants from Vietnam (37.1%, a difference of 0.20%), Yugoslavian (37.1%, a difference of 0.27%), Slovak (37.3%, a difference of 0.32%), and Immigrants from Oceania (37.3%, a difference of 0.37%).
| Demographics | Rating | Rank | Bachelor's Degree |
| Scandinavians | 41.7 /100 | #184 | Average 37.5% |
| Immigrants | Peru | 41.3 /100 | #185 | Average 37.5% |
| Norwegians | 40.4 /100 | #186 | Average 37.5% |
| English | 39.7 /100 | #187 | Fair 37.4% |
| Immigrants | Oceania | 37.3 /100 | #188 | Fair 37.3% |
| Slovaks | 36.9 /100 | #189 | Fair 37.3% |
| Swiss | 34.1 /100 | #190 | Fair 37.2% |
| Nigerians | 33.9 /100 | #191 | Fair 37.2% |
| Immigrants | Vietnam | 32.1 /100 | #192 | Fair 37.1% |
| Yugoslavians | 31.5 /100 | #193 | Fair 37.1% |
| Belgians | 29.9 /100 | #194 | Fair 37.0% |
| Koreans | 29.8 /100 | #195 | Fair 37.0% |
| Celtics | 29.5 /100 | #196 | Fair 37.0% |
| Czechoslovakians | 29.2 /100 | #197 | Fair 37.0% |
| Welsh | 29.1 /100 | #198 | Fair 37.0% |
Demographics Similar to Immigrants from Switzerland by Bachelor's Degree
In terms of bachelor's degree, the demographic groups most similar to Immigrants from Switzerland are Immigrants from Ireland (47.1%, a difference of 0.010%), Immigrants from Belgium (47.0%, a difference of 0.21%), Cambodian (47.2%, a difference of 0.22%), Immigrants from Sweden (47.0%, a difference of 0.30%), and Immigrants from Korea (47.0%, a difference of 0.34%).
| Demographics | Rating | Rank | Bachelor's Degree |
| Immigrants | South Central Asia | 100.0 /100 | #13 | Exceptional 48.3% |
| Immigrants | Hong Kong | 100.0 /100 | #14 | Exceptional 48.2% |
| Immigrants | Eastern Asia | 100.0 /100 | #15 | Exceptional 48.1% |
| Soviet Union | 100.0 /100 | #16 | Exceptional 47.9% |
| Eastern Europeans | 100.0 /100 | #17 | Exceptional 47.5% |
| Indians (Asian) | 100.0 /100 | #18 | Exceptional 47.4% |
| Cambodians | 100.0 /100 | #19 | Exceptional 47.2% |
| Immigrants | Switzerland | 100.0 /100 | #20 | Exceptional 47.1% |
| Immigrants | Ireland | 100.0 /100 | #21 | Exceptional 47.1% |
| Immigrants | Belgium | 100.0 /100 | #22 | Exceptional 47.0% |
| Immigrants | Sweden | 100.0 /100 | #23 | Exceptional 47.0% |
| Immigrants | Korea | 100.0 /100 | #24 | Exceptional 47.0% |
| Burmese | 100.0 /100 | #25 | Exceptional 46.9% |
| Immigrants | Japan | 100.0 /100 | #26 | Exceptional 46.8% |
| Immigrants | France | 100.0 /100 | #27 | Exceptional 46.4% |