Nigerian vs Immigrants from Iran High School Diploma
COMPARE
Nigerian
Immigrants from Iran
High School Diploma
High School Diploma Comparison
Nigerians
Immigrants from Iran
88.2%
HIGH SCHOOL DIPLOMA
5.2/ 100
METRIC RATING
229th/ 347
METRIC RANK
90.9%
HIGH SCHOOL DIPLOMA
99.5/ 100
METRIC RATING
67th/ 347
METRIC RANK
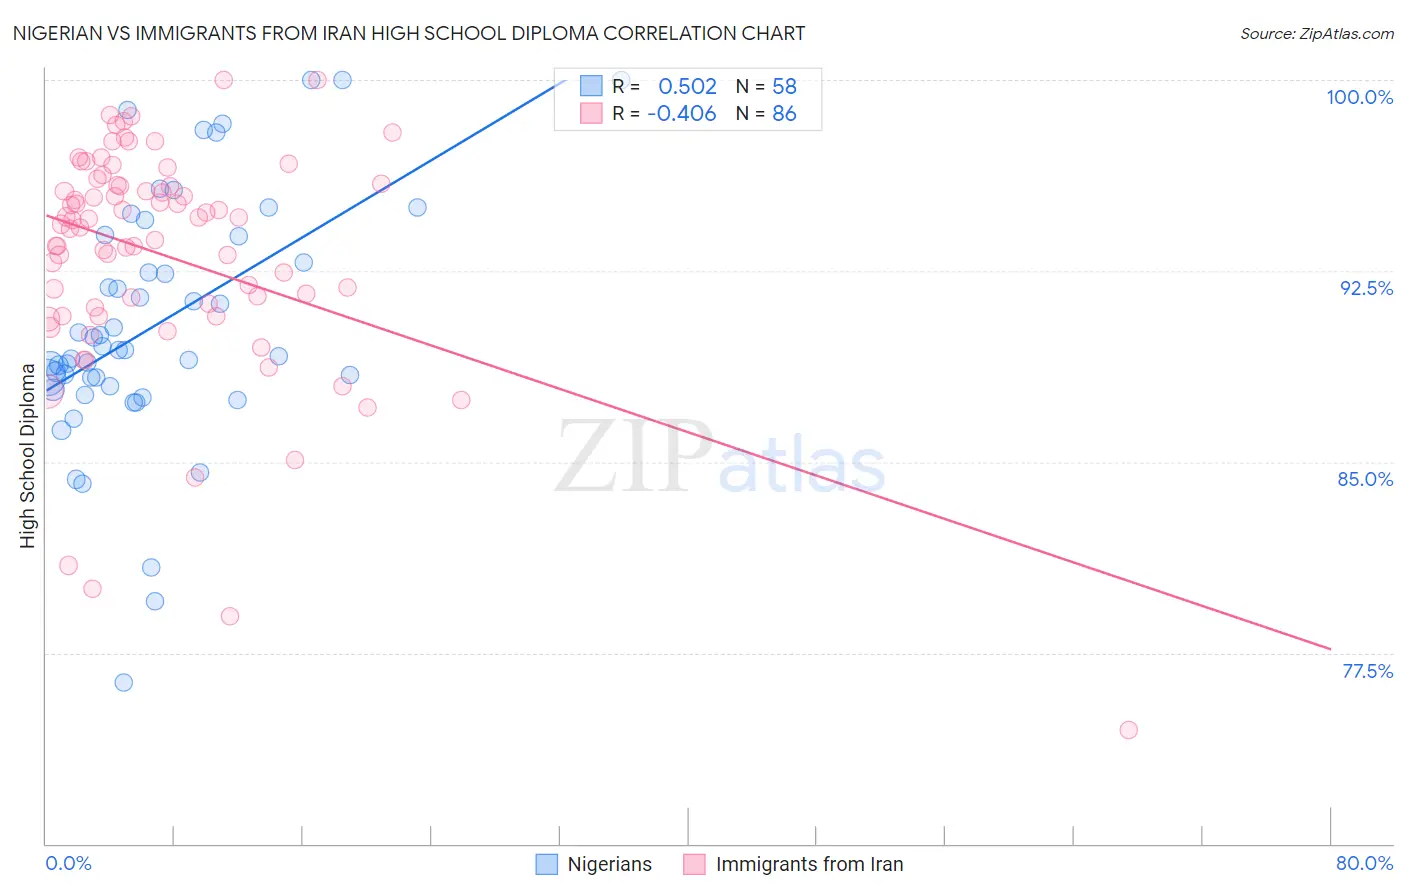
Nigerian vs Immigrants from Iran High School Diploma Correlation Chart
The statistical analysis conducted on geographies consisting of 332,724,627 people shows a substantial positive correlation between the proportion of Nigerians and percentage of population with at least high school diploma education in the United States with a correlation coefficient (R) of 0.502 and weighted average of 88.2%. Similarly, the statistical analysis conducted on geographies consisting of 279,904,902 people shows a moderate negative correlation between the proportion of Immigrants from Iran and percentage of population with at least high school diploma education in the United States with a correlation coefficient (R) of -0.406 and weighted average of 90.9%, a difference of 3.1%.
High School Diploma Correlation Summary
| Measurement | Nigerian | Immigrants from Iran |
| Minimum | 76.3% | 74.5% |
| Maximum | 100.0% | 100.0% |
| Range | 23.7% | 25.5% |
| Mean | 90.4% | 93.1% |
| Median | 89.4% | 94.4% |
| Interquartile 25% (IQ1) | 88.0% | 91.1% |
| Interquartile 75% (IQ3) | 93.9% | 95.9% |
| Interquartile Range (IQR) | 5.9% | 4.8% |
| Standard Deviation (Sample) | 4.9% | 4.6% |
| Standard Deviation (Population) | 4.8% | 4.6% |
Similar Demographics by High School Diploma
Demographics Similar to Nigerians by High School Diploma
In terms of high school diploma, the demographic groups most similar to Nigerians are Kiowa (88.2%, a difference of 0.010%), Immigrants from Liberia (88.2%, a difference of 0.020%), Uruguayan (88.2%, a difference of 0.030%), Blackfeet (88.1%, a difference of 0.080%), and Creek (88.3%, a difference of 0.11%).
| Demographics | Rating | Rank | High School Diploma |
| Colville | 7.8 /100 | #222 | Tragic 88.3% |
| Immigrants | Zaire | 7.6 /100 | #223 | Tragic 88.3% |
| Shoshone | 7.0 /100 | #224 | Tragic 88.3% |
| Creek | 6.9 /100 | #225 | Tragic 88.3% |
| Uruguayans | 5.6 /100 | #226 | Tragic 88.2% |
| Immigrants | Liberia | 5.5 /100 | #227 | Tragic 88.2% |
| Kiowa | 5.3 /100 | #228 | Tragic 88.2% |
| Nigerians | 5.2 /100 | #229 | Tragic 88.2% |
| Blackfeet | 4.2 /100 | #230 | Tragic 88.1% |
| Colombians | 3.8 /100 | #231 | Tragic 88.1% |
| Immigrants | Middle Africa | 3.4 /100 | #232 | Tragic 88.0% |
| Immigrants | Panama | 3.1 /100 | #233 | Tragic 88.0% |
| Immigrants | Thailand | 3.1 /100 | #234 | Tragic 88.0% |
| Immigrants | Bahamas | 2.9 /100 | #235 | Tragic 88.0% |
| Sub-Saharan Africans | 2.8 /100 | #236 | Tragic 87.9% |
Demographics Similar to Immigrants from Iran by High School Diploma
In terms of high school diploma, the demographic groups most similar to Immigrants from Iran are Czechoslovakian (90.9%, a difference of 0.010%), French (91.0%, a difference of 0.020%), Ukrainian (91.0%, a difference of 0.030%), Immigrants from South Africa (91.0%, a difference of 0.030%), and Immigrants from Netherlands (91.0%, a difference of 0.040%).
| Demographics | Rating | Rank | High School Diploma |
| Immigrants | Japan | 99.6 /100 | #60 | Exceptional 91.0% |
| Immigrants | Taiwan | 99.6 /100 | #61 | Exceptional 91.0% |
| Austrians | 99.6 /100 | #62 | Exceptional 91.0% |
| Immigrants | Netherlands | 99.6 /100 | #63 | Exceptional 91.0% |
| Ukrainians | 99.6 /100 | #64 | Exceptional 91.0% |
| Immigrants | South Africa | 99.6 /100 | #65 | Exceptional 91.0% |
| French | 99.5 /100 | #66 | Exceptional 91.0% |
| Immigrants | Iran | 99.5 /100 | #67 | Exceptional 90.9% |
| Czechoslovakians | 99.5 /100 | #68 | Exceptional 90.9% |
| French Canadians | 99.5 /100 | #69 | Exceptional 90.9% |
| Immigrants | Latvia | 99.5 /100 | #70 | Exceptional 90.9% |
| Alaskan Athabascans | 99.4 /100 | #71 | Exceptional 90.9% |
| Soviet Union | 99.4 /100 | #72 | Exceptional 90.9% |
| Immigrants | South Central Asia | 99.4 /100 | #73 | Exceptional 90.9% |
| Immigrants | Czechoslovakia | 99.4 /100 | #74 | Exceptional 90.9% |