Nicaraguan vs Hmong Professional Degree
COMPARE
Nicaraguan
Hmong
Professional Degree
Professional Degree Comparison
Nicaraguans
Hmong
3.9%
PROFESSIONAL DEGREE
5.1/ 100
METRIC RATING
230th/ 347
METRIC RANK
3.7%
PROFESSIONAL DEGREE
1.6/ 100
METRIC RATING
248th/ 347
METRIC RANK
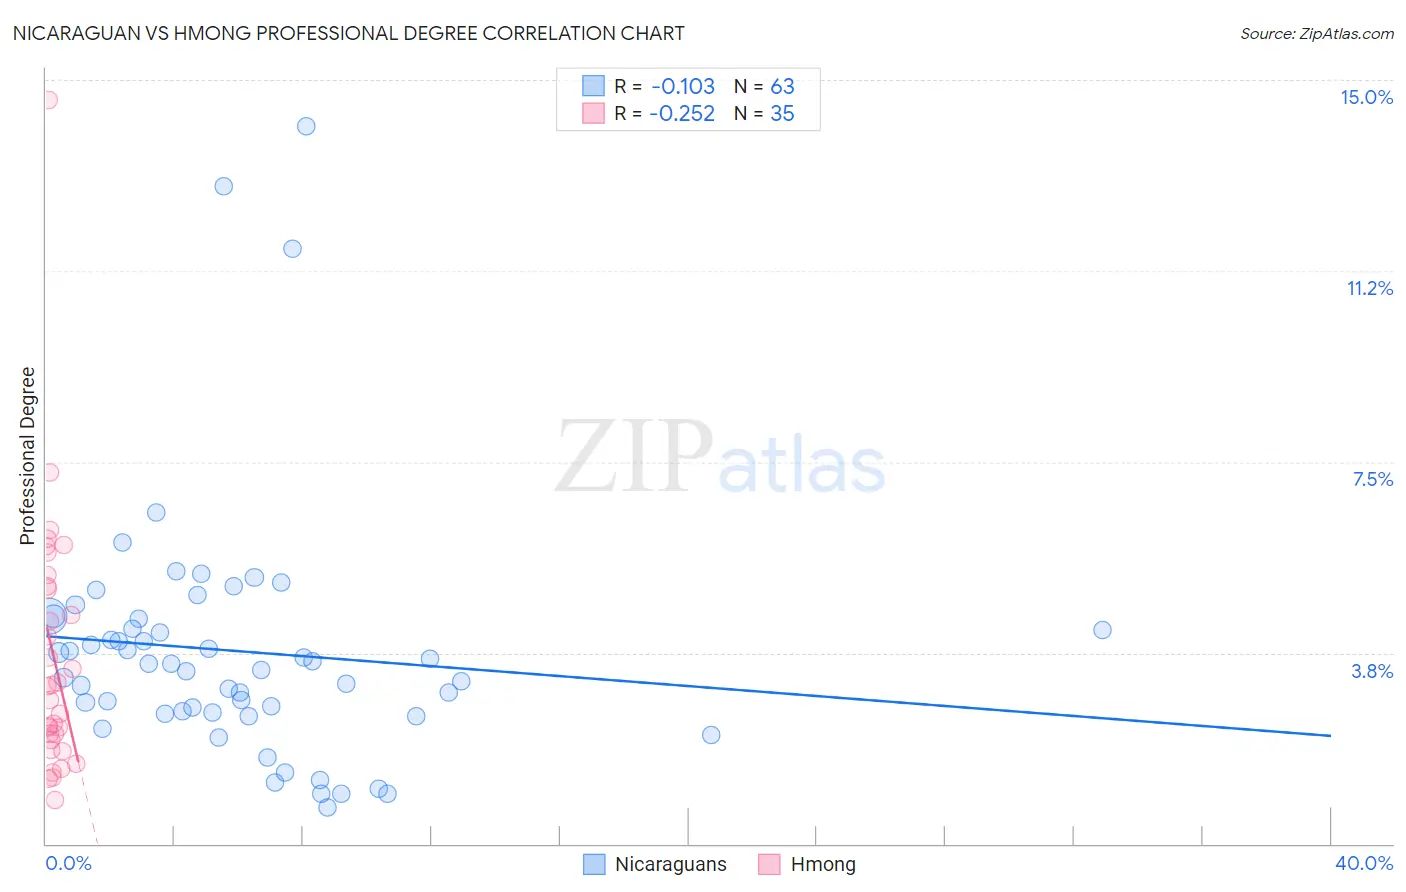
Nicaraguan vs Hmong Professional Degree Correlation Chart
The statistical analysis conducted on geographies consisting of 285,287,812 people shows a poor negative correlation between the proportion of Nicaraguans and percentage of population with at least professional degree education in the United States with a correlation coefficient (R) of -0.103 and weighted average of 3.9%. Similarly, the statistical analysis conducted on geographies consisting of 24,646,446 people shows a weak negative correlation between the proportion of Hmong and percentage of population with at least professional degree education in the United States with a correlation coefficient (R) of -0.252 and weighted average of 3.7%, a difference of 5.1%.
Professional Degree Correlation Summary
| Measurement | Nicaraguan | Hmong |
| Minimum | 0.72% | 0.86% |
| Maximum | 14.1% | 14.6% |
| Range | 13.4% | 13.7% |
| Mean | 3.8% | 3.7% |
| Median | 3.5% | 3.1% |
| Interquartile 25% (IQ1) | 2.6% | 2.0% |
| Interquartile 75% (IQ3) | 4.4% | 5.1% |
| Interquartile Range (IQR) | 1.8% | 3.0% |
| Standard Deviation (Sample) | 2.4% | 2.6% |
| Standard Deviation (Population) | 2.4% | 2.5% |
Demographics Similar to Nicaraguans and Hmong by Professional Degree
In terms of professional degree, the demographic groups most similar to Nicaraguans are Immigrants from Burma/Myanmar (3.9%, a difference of 0.27%), Ecuadorian (3.9%, a difference of 0.46%), Cree (3.9%, a difference of 0.67%), Immigrants from Philippines (3.9%, a difference of 0.93%), and Nonimmigrants (3.9%, a difference of 0.98%). Similarly, the demographic groups most similar to Hmong are Immigrants from Grenada (3.7%, a difference of 0.11%), Guyanese (3.8%, a difference of 0.16%), Marshallese (3.8%, a difference of 0.18%), French American Indian (3.8%, a difference of 0.36%), and Immigrants from Bahamas (3.8%, a difference of 1.1%).
| Demographics | Rating | Rank | Professional Degree |
| Immigrants | Burma/Myanmar | 5.4 /100 | #229 | Tragic 3.9% |
| Nicaraguans | 5.1 /100 | #230 | Tragic 3.9% |
| Ecuadorians | 4.6 /100 | #231 | Tragic 3.9% |
| Cree | 4.3 /100 | #232 | Tragic 3.9% |
| Immigrants | Philippines | 4.1 /100 | #233 | Tragic 3.9% |
| Immigrants | Nonimmigrants | 4.0 /100 | #234 | Tragic 3.9% |
| Immigrants | Barbados | 4.0 /100 | #235 | Tragic 3.9% |
| Spanish Americans | 3.8 /100 | #236 | Tragic 3.9% |
| Immigrants | Trinidad and Tobago | 3.8 /100 | #237 | Tragic 3.9% |
| Colville | 2.6 /100 | #238 | Tragic 3.8% |
| British West Indians | 2.4 /100 | #239 | Tragic 3.8% |
| Immigrants | Ecuador | 2.3 /100 | #240 | Tragic 3.8% |
| Alaskan Athabascans | 2.3 /100 | #241 | Tragic 3.8% |
| Native Hawaiians | 2.3 /100 | #242 | Tragic 3.8% |
| Guamanians/Chamorros | 2.2 /100 | #243 | Tragic 3.8% |
| Immigrants | Bahamas | 2.0 /100 | #244 | Tragic 3.8% |
| French American Indians | 1.7 /100 | #245 | Tragic 3.8% |
| Marshallese | 1.7 /100 | #246 | Tragic 3.8% |
| Guyanese | 1.6 /100 | #247 | Tragic 3.8% |
| Hmong | 1.6 /100 | #248 | Tragic 3.7% |
| Immigrants | Grenada | 1.5 /100 | #249 | Tragic 3.7% |