New Zealander vs Immigrants from Switzerland No Schooling Completed
COMPARE
New Zealander
Immigrants from Switzerland
No Schooling Completed
No Schooling Completed Comparison
New Zealanders
Immigrants from Switzerland
1.7%
NO SCHOOLING COMPLETED
99.7/ 100
METRIC RATING
64th/ 347
METRIC RANK
1.8%
NO SCHOOLING COMPLETED
97.9/ 100
METRIC RATING
102nd/ 347
METRIC RANK
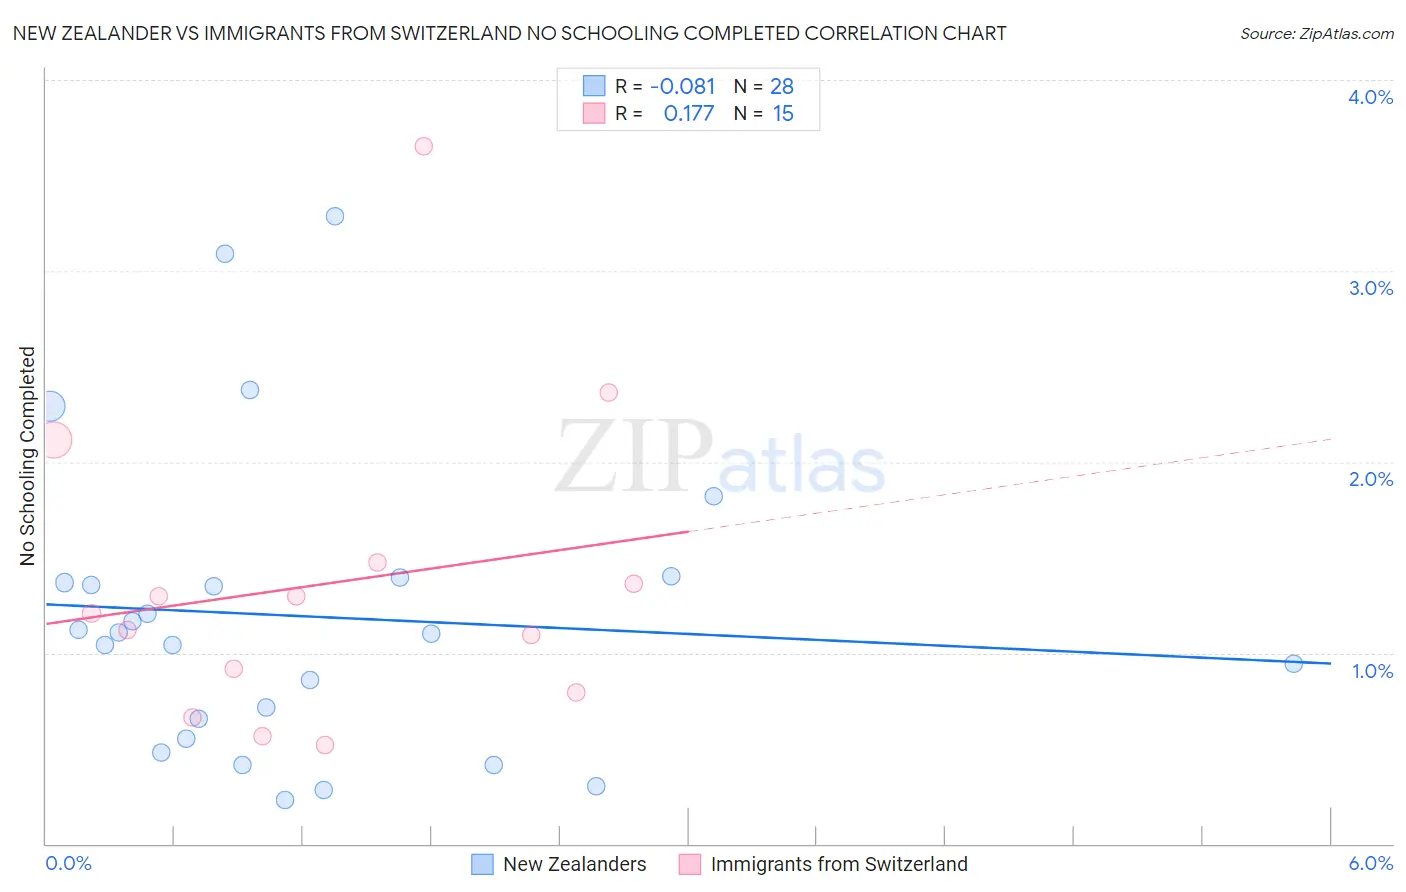
New Zealander vs Immigrants from Switzerland No Schooling Completed Correlation Chart
The statistical analysis conducted on geographies consisting of 106,449,248 people shows a slight negative correlation between the proportion of New Zealanders and percentage of population with no schooling in the United States with a correlation coefficient (R) of -0.081 and weighted average of 1.7%. Similarly, the statistical analysis conducted on geographies consisting of 147,132,968 people shows a poor positive correlation between the proportion of Immigrants from Switzerland and percentage of population with no schooling in the United States with a correlation coefficient (R) of 0.177 and weighted average of 1.8%, a difference of 9.0%.
No Schooling Completed Correlation Summary
| Measurement | New Zealander | Immigrants from Switzerland |
| Minimum | 0.23% | 0.51% |
| Maximum | 3.3% | 3.7% |
| Range | 3.1% | 3.1% |
| Mean | 1.2% | 1.4% |
| Median | 1.1% | 1.2% |
| Interquartile 25% (IQ1) | 0.60% | 0.79% |
| Interquartile 75% (IQ3) | 1.4% | 1.5% |
| Interquartile Range (IQR) | 0.78% | 0.68% |
| Standard Deviation (Sample) | 0.78% | 0.82% |
| Standard Deviation (Population) | 0.77% | 0.79% |
Similar Demographics by No Schooling Completed
Demographics Similar to New Zealanders by No Schooling Completed
In terms of no schooling completed, the demographic groups most similar to New Zealanders are Serbian (1.7%, a difference of 0.040%), Russian (1.7%, a difference of 0.16%), Canadian (1.7%, a difference of 0.18%), Immigrants from Northern Europe (1.7%, a difference of 0.20%), and Immigrants from Austria (1.7%, a difference of 0.37%).
| Demographics | Rating | Rank | No Schooling Completed |
| Austrians | 99.8 /100 | #57 | Exceptional 1.6% |
| Kiowa | 99.8 /100 | #58 | Exceptional 1.6% |
| Slavs | 99.8 /100 | #59 | Exceptional 1.7% |
| Americans | 99.8 /100 | #60 | Exceptional 1.7% |
| Tsimshian | 99.8 /100 | #61 | Exceptional 1.7% |
| Immigrants | Northern Europe | 99.8 /100 | #62 | Exceptional 1.7% |
| Russians | 99.8 /100 | #63 | Exceptional 1.7% |
| New Zealanders | 99.7 /100 | #64 | Exceptional 1.7% |
| Serbians | 99.7 /100 | #65 | Exceptional 1.7% |
| Canadians | 99.7 /100 | #66 | Exceptional 1.7% |
| Immigrants | Austria | 99.7 /100 | #67 | Exceptional 1.7% |
| Immigrants | Lithuania | 99.7 /100 | #68 | Exceptional 1.7% |
| Chickasaw | 99.6 /100 | #69 | Exceptional 1.7% |
| Immigrants | Netherlands | 99.6 /100 | #70 | Exceptional 1.7% |
| Immigrants | England | 99.5 /100 | #71 | Exceptional 1.7% |
Demographics Similar to Immigrants from Switzerland by No Schooling Completed
In terms of no schooling completed, the demographic groups most similar to Immigrants from Switzerland are Immigrants from Czechoslovakia (1.8%, a difference of 0.0%), Basque (1.8%, a difference of 0.050%), Immigrants from Singapore (1.8%, a difference of 0.30%), Choctaw (1.8%, a difference of 0.50%), and Thai (1.8%, a difference of 0.63%).
| Demographics | Rating | Rank | No Schooling Completed |
| Puget Sound Salish | 98.5 /100 | #95 | Exceptional 1.8% |
| Bhutanese | 98.4 /100 | #96 | Exceptional 1.8% |
| Immigrants | Ireland | 98.4 /100 | #97 | Exceptional 1.8% |
| Iranians | 98.2 /100 | #98 | Exceptional 1.8% |
| Choctaw | 98.1 /100 | #99 | Exceptional 1.8% |
| Immigrants | Singapore | 98.0 /100 | #100 | Exceptional 1.8% |
| Immigrants | Czechoslovakia | 97.9 /100 | #101 | Exceptional 1.8% |
| Immigrants | Switzerland | 97.9 /100 | #102 | Exceptional 1.8% |
| Basques | 97.9 /100 | #103 | Exceptional 1.8% |
| Thais | 97.5 /100 | #104 | Exceptional 1.8% |
| German Russians | 97.5 /100 | #105 | Exceptional 1.8% |
| Immigrants | France | 97.3 /100 | #106 | Exceptional 1.8% |
| Yugoslavians | 97.2 /100 | #107 | Exceptional 1.8% |
| Okinawans | 97.1 /100 | #108 | Exceptional 1.8% |
| Immigrants | Saudi Arabia | 96.8 /100 | #109 | Exceptional 1.9% |