Nepalese vs Thai 8th Grade

COMPARE

Nepalese
Race
Ancestry
AfghanAfricanAlaska NativeAlaskan AthabascanAlbanianAleutAlsatianAmericanApacheArabArapahoArgentineanArmenianAssyrian/Chaldean/SyriacAustralianAustrianBahamianBangladeshiBarbadianBasqueBelgianBelizeanBermudanBhutaneseBlackfeetBolivianBrazilianBritishBritish West IndianBulgarianBurmeseCajunCambodianCanadianCape VerdeanCarpatho RusynCelticCentral AmericanCentral American IndianCherokeeCheyenneChickasawChileanChineseChippewaChoctawColombianColvilleComancheCosta RicanCreeCreekCroatianCrowCubanCypriotCzechCzechoslovakianDanishDelawareDominicanDutchDutch West IndianEastern EuropeanEcuadorianEgyptianEnglishEstonianEthiopianEuropeanFijianFilipinoFinnishFrenchFrench American IndianFrench CanadianGermanGerman RussianGhanaianGreekGuamanian/ChamorroGuatemalanGuyaneseHaitianHmongHonduranHopiHoumaHungarianIcelanderIndian (Asian)IndonesianInupiatIranianIraqiIrishIroquoisIsraeliItalianJamaicanJapaneseJordanianKenyanKiowaKoreanLaotianLatvianLebaneseLiberianLithuanianLumbeeLuxembourgerMacedonianMalaysianMalteseMarshalleseMenomineeMexicanMexican American IndianMongolianMoroccanNative HawaiianNavajoNepaleseNew ZealanderNicaraguanNigerianNorthern EuropeanNorwegianOkinawanOsageOttawaPaiutePakistaniPalestinianPanamanianParaguayanPennsylvania GermanPeruvianPimaPolishPortuguesePotawatomiPuebloPuerto RicanPuget Sound SalishRomanianRussianSalvadoranSamoanScandinavianScotch-IrishScottishSeminoleSenegaleseSerbianShoshoneSierra LeoneanSiouxSlavicSlovakSloveneSomaliSouth AfricanSouth AmericanSouth American IndianSoviet UnionSpaniardSpanishSpanish AmericanSpanish American IndianSri LankanSubsaharan AfricanSudaneseSwedishSwissSyrianTaiwaneseTlingit-HaidaTohono O'OdhamTonganTrinidadian and TobagonianTsimshianTurkishU.S. Virgin IslanderUgandanUkrainianUruguayanUteVenezuelanVietnameseWelshWest IndianYakamaYaquiYugoslavianYumanYup'ikZimbabwean
Immigration
NonimmigrantsImmigrantsAfghanistanAfricaAlbaniaArgentinaArmeniaAsiaAustraliaAustriaBahamasBangladeshBarbadosBelarusBelgiumBelizeBoliviaBosnia and HerzegovinaBrazilBulgariaBurma/MyanmarCabo VerdeCambodiaCameroonCanadaCaribbeanCentral AmericaChileChinaColombiaCongoCosta RicaCroatiaCubaCzechoslovakiaDenmarkDominicaDominican RepublicEastern AfricaEastern AsiaEastern EuropeEcuadorEgyptEl SalvadorEnglandEritreaEthiopiaEuropeFijiFranceGermanyGhanaGreeceGrenadaGuatemalaGuyanaHaitiHondurasHong KongHungaryIndiaIndonesiaIranIraqIrelandIsraelItalyJamaicaJapanJordanKazakhstanKenyaKoreaKuwaitLaosLatin AmericaLatviaLebanonLiberiaLithuaniaMalaysiaMexicoMicronesiaMiddle AfricaMoldovaMoroccoNepalNetherlandsNicaraguaNigeriaNorth AmericaNorth MacedoniaNorthern AfricaNorthern EuropeNorwayOceaniaPakistanPanamaPeruPhilippinesPolandPortugalRomaniaRussiaSaudi ArabiaScotlandSenegalSerbiaSierra LeoneSingaporeSomaliaSouth AfricaSouth AmericaSouth Central AsiaSouth Eastern AsiaSouthern EuropeSpainSri LankaSt. Vincent and the GrenadinesSudanSwedenSwitzerlandSyriaTaiwanThailandTrinidad and TobagoTurkeyUgandaUkraineUruguayUzbekistanVenezuelaVietnamWest IndiesWestern AfricaWestern AsiaWestern EuropeYemenZaireZimbabweAzores
Thai
Race
Ancestry
AfghanAfricanAlaska NativeAlaskan AthabascanAlbanianAleutAlsatianAmericanApacheArabArapahoArgentineanArmenianAssyrian/Chaldean/SyriacAustralianAustrianBahamianBangladeshiBarbadianBasqueBelgianBelizeanBermudanBhutaneseBlackfeetBolivianBrazilianBritishBritish West IndianBulgarianBurmeseCajunCambodianCanadianCape VerdeanCarpatho RusynCelticCentral AmericanCentral American IndianCherokeeCheyenneChickasawChileanChineseChippewaChoctawColombianColvilleComancheCosta RicanCreeCreekCroatianCrowCubanCypriotCzechCzechoslovakianDanishDelawareDominicanDutchDutch West IndianEastern EuropeanEcuadorianEgyptianEnglishEstonianEthiopianEuropeanFijianFilipinoFinnishFrenchFrench American IndianFrench CanadianGermanGerman RussianGhanaianGreekGuamanian/ChamorroGuatemalanGuyaneseHaitianHmongHonduranHopiHoumaHungarianIcelanderIndian (Asian)IndonesianInupiatIranianIraqiIrishIroquoisIsraeliItalianJamaicanJapaneseJordanianKenyanKiowaKoreanLaotianLatvianLebaneseLiberianLithuanianLumbeeLuxembourgerMacedonianMalaysianMalteseMarshalleseMenomineeMexicanMexican American IndianMongolianMoroccanNative HawaiianNavajoNew ZealanderNicaraguanNigerianNorthern EuropeanNorwegianOkinawanOsageOttawaPaiutePakistaniPalestinianPanamanianParaguayanPennsylvania GermanPeruvianPimaPolishPortuguesePotawatomiPuebloPuerto RicanPuget Sound SalishRomanianRussianSalvadoranSamoanScandinavianScotch-IrishScottishSeminoleSenegaleseSerbianShoshoneSierra LeoneanSiouxSlavicSlovakSloveneSomaliSouth AfricanSouth AmericanSouth American IndianSoviet UnionSpaniardSpanishSpanish AmericanSpanish American IndianSri LankanSubsaharan AfricanSudaneseSwedishSwissSyrianTaiwaneseThaiTlingit-HaidaTohono O'OdhamTonganTrinidadian and TobagonianTsimshianTurkishU.S. Virgin IslanderUgandanUkrainianUruguayanUteVenezuelanVietnameseWelshWest IndianYakamaYaquiYugoslavianYumanYup'ikZimbabwean
Immigration
NonimmigrantsImmigrantsAfghanistanAfricaAlbaniaArgentinaArmeniaAsiaAustraliaAustriaBahamasBangladeshBarbadosBelarusBelgiumBelizeBoliviaBosnia and HerzegovinaBrazilBulgariaBurma/MyanmarCabo VerdeCambodiaCameroonCanadaCaribbeanCentral AmericaChileChinaColombiaCongoCosta RicaCroatiaCubaCzechoslovakiaDenmarkDominicaDominican RepublicEastern AfricaEastern AsiaEastern EuropeEcuadorEgyptEl SalvadorEnglandEritreaEthiopiaEuropeFijiFranceGermanyGhanaGreeceGrenadaGuatemalaGuyanaHaitiHondurasHong KongHungaryIndiaIndonesiaIranIraqIrelandIsraelItalyJamaicaJapanJordanKazakhstanKenyaKoreaKuwaitLaosLatin AmericaLatviaLebanonLiberiaLithuaniaMalaysiaMexicoMicronesiaMiddle AfricaMoldovaMoroccoNepalNetherlandsNicaraguaNigeriaNorth AmericaNorth MacedoniaNorthern AfricaNorthern EuropeNorwayOceaniaPakistanPanamaPeruPhilippinesPolandPortugalRomaniaRussiaSaudi ArabiaScotlandSenegalSerbiaSierra LeoneSingaporeSomaliaSouth AfricaSouth AmericaSouth Central AsiaSouth Eastern AsiaSouthern EuropeSpainSri LankaSt. Vincent and the GrenadinesSudanSwedenSwitzerlandSyriaTaiwanThailandTrinidad and TobagoTurkeyUgandaUkraineUruguayUzbekistanVenezuelaVietnamWest IndiesWestern AfricaWestern AsiaWestern EuropeYemenZaireZimbabweAzores
8th Grade
Income
Poverty
Unemployment
Labor Participation
Family Structure
Vehicle Availability
Education Level
Disability

8th Grade Comparison

Nepalese

Thais

Tragic
Exceptional
92.8%
8TH GRADE
0.0/ 100
METRIC RATING
324th/ 347
METRIC RANK
96.4%
8TH GRADE
98.9/ 100
METRIC RATING
91st/ 347
METRIC RANK

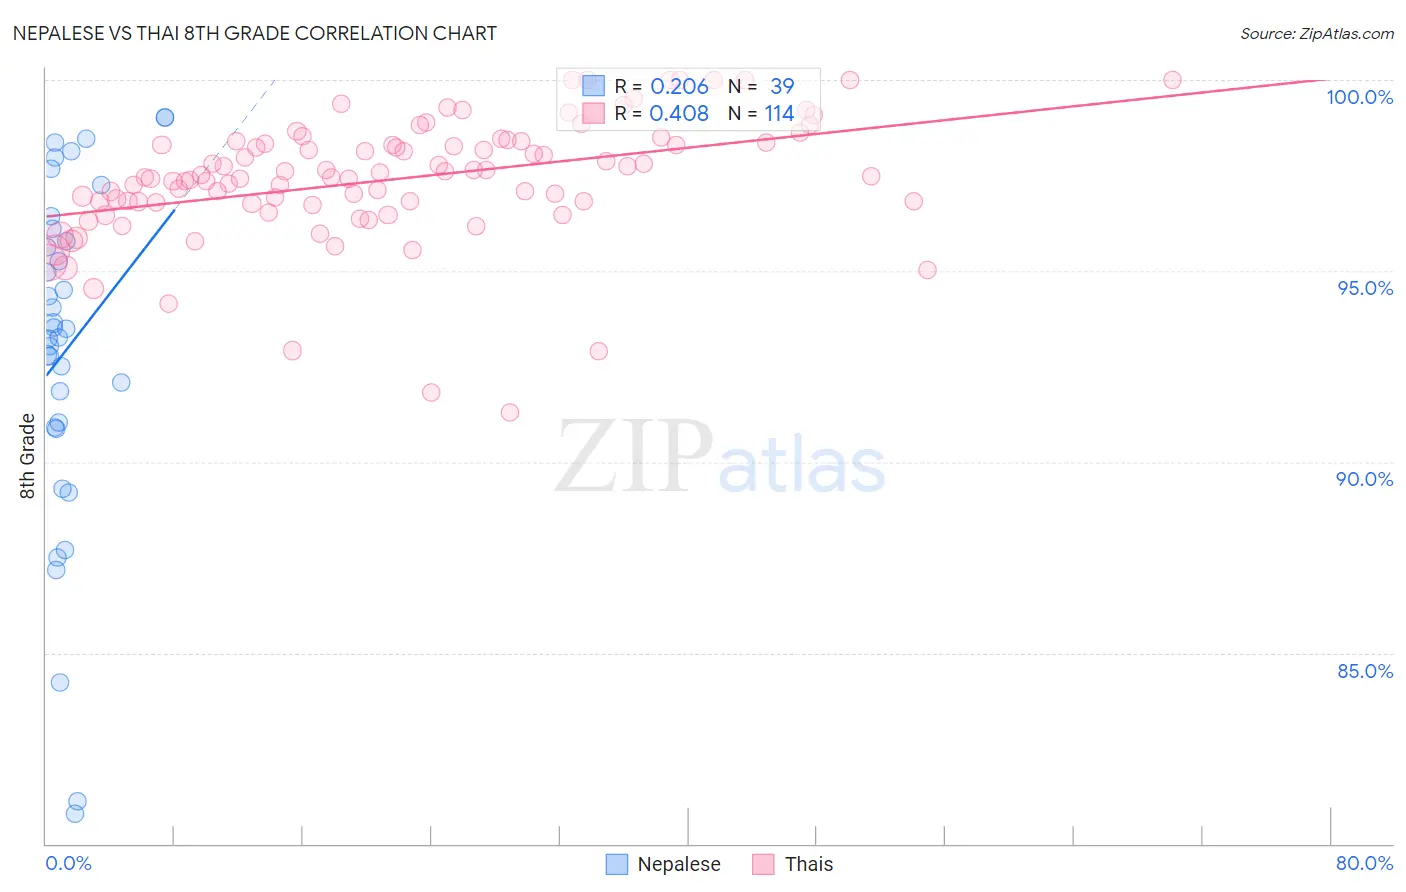
Nepalese vs Thai 8th Grade Correlation Chart

The statistical analysis conducted on geographies consisting of 24,519,269 people shows a weak positive correlation between the proportion of Nepalese and percentage of population with at least 8th grade education in the United States with a correlation coefficient (R) of 0.206 and weighted average of 92.8%. Similarly, the statistical analysis conducted on geographies consisting of 475,814,962 people shows a moderate positive correlation between the proportion of Thais and percentage of population with at least 8th grade education in the United States with a correlation coefficient (R) of 0.408 and weighted average of 96.4%, a difference of 3.8%.
Nepalese vs Thai 8th Grade

8th Grade Correlation Summary

MeasurementNepaleseThai
Minimum80.8%91.3%
Maximum99.0%100.0%
Range18.2%8.7%
Mean92.9%97.4%
Median93.5%97.5%
Interquartile 25% (IQ1)90.9%96.8%
Interquartile 75% (IQ3)96.1%98.4%
Interquartile Range (IQR)5.2%1.6%
Standard Deviation (Sample)4.5%1.6%
Standard Deviation (Population)4.5%1.6%

Similar Demographics by 8th Grade

Demographics Similar to Nepalese by 8th Grade

In terms of 8th grade, the demographic groups most similar to Nepalese are Immigrants from Belize (92.9%, a difference of 0.070%), Dominican (92.8%, a difference of 0.090%), Nicaraguan (93.0%, a difference of 0.12%), Central American Indian (92.7%, a difference of 0.14%), and Belizean (93.1%, a difference of 0.24%).
DemographicsRating | Rank8th Grade
Immigrants | Ecuador
0.0
/100
|
#317
Tragic
93.3%
Puerto Ricans
0.0
/100
|
#318
Tragic
93.2%
Immigrants | Cuba
0.0
/100
|
#319
Tragic
93.2%
Immigrants | Fiji
0.0
/100
|
#320
Tragic
93.2%
Belizeans
0.0
/100
|
#321
Tragic
93.1%
Nicaraguans
0.0
/100
|
#322
Tragic
93.0%
Immigrants | Belize
0.0
/100
|
#323
Tragic
92.9%
Nepalese
0.0
/100
|
#324
Tragic
92.8%
Dominicans
0.0
/100
|
#325
Tragic
92.8%
Central American Indians
0.0
/100
|
#326
Tragic
92.7%
Immigrants | Azores
0.0
/100
|
#327
Tragic
92.5%
Immigrants | Nicaragua
0.0
/100
|
#328
Tragic
92.5%
Immigrants | Cabo Verde
0.0
/100
|
#329
Tragic
92.4%
Immigrants | Armenia
0.0
/100
|
#330
Tragic
92.3%
Hondurans
0.0
/100
|
#331
Tragic
92.3%

Demographics Similar to Thais by 8th Grade

In terms of 8th grade, the demographic groups most similar to Thais are Immigrants from Sweden (96.4%, a difference of 0.0%), Menominee (96.4%, a difference of 0.0%), Immigrants from Denmark (96.4%, a difference of 0.0%), Chickasaw (96.4%, a difference of 0.010%), and Immigrants from Singapore (96.4%, a difference of 0.010%).
DemographicsRating | Rank8th Grade
Immigrants | Belgium
99.1
/100
|
#84
Exceptional
96.5%
Immigrants | South Africa
99.1
/100
|
#85
Exceptional
96.5%
Cherokee
99.0
/100
|
#86
Exceptional
96.5%
Immigrants | Australia
99.0
/100
|
#87
Exceptional
96.5%
Immigrants | Western Europe
99.0
/100
|
#88
Exceptional
96.4%
Chickasaw
98.9
/100
|
#89
Exceptional
96.4%
Immigrants | Sweden
98.9
/100
|
#90
Exceptional
96.4%
Thais
98.9
/100
|
#91
Exceptional
96.4%
Menominee
98.9
/100
|
#92
Exceptional
96.4%
Immigrants | Denmark
98.8
/100
|
#93
Exceptional
96.4%
Immigrants | Singapore
98.8
/100
|
#94
Exceptional
96.4%
German Russians
98.8
/100
|
#95
Exceptional
96.4%
Potawatomi
98.7
/100
|
#96
Exceptional
96.4%
Osage
98.7
/100
|
#97
Exceptional
96.4%
Immigrants | Germany
98.7
/100
|
#98
Exceptional
96.4%