Nepalese vs Immigrants from Portugal 7th Grade
COMPARE
Nepalese
Immigrants from Portugal
7th Grade
7th Grade Comparison
Nepalese
Immigrants from Portugal
93.2%
7TH GRADE
0.0/ 100
METRIC RATING
326th/ 347
METRIC RANK
94.2%
7TH GRADE
0.0/ 100
METRIC RATING
307th/ 347
METRIC RANK
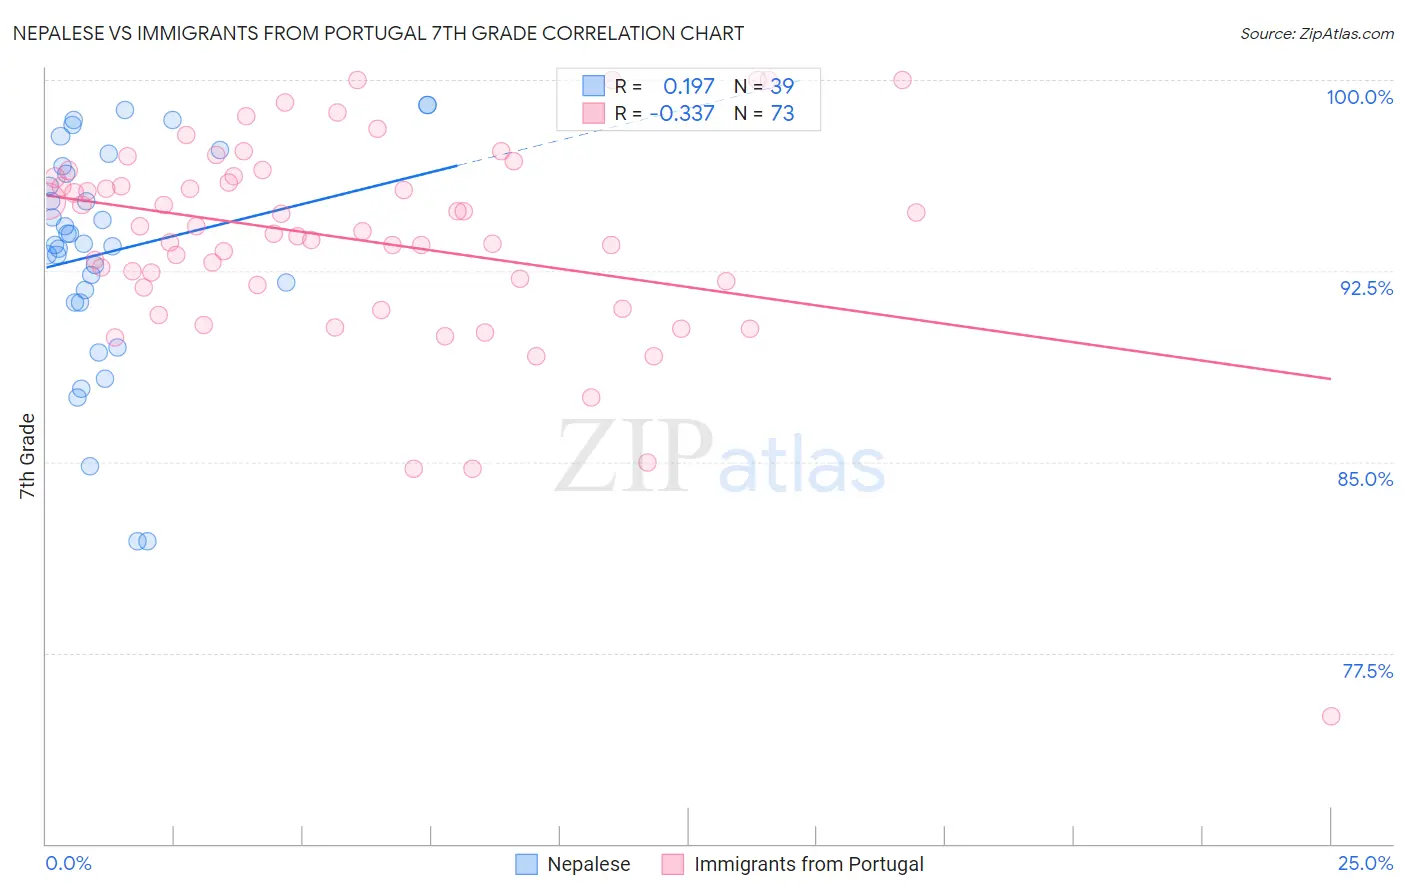
Nepalese vs Immigrants from Portugal 7th Grade Correlation Chart
The statistical analysis conducted on geographies consisting of 24,519,269 people shows a poor positive correlation between the proportion of Nepalese and percentage of population with at least 7th grade education in the United States with a correlation coefficient (R) of 0.197 and weighted average of 93.2%. Similarly, the statistical analysis conducted on geographies consisting of 174,792,107 people shows a mild negative correlation between the proportion of Immigrants from Portugal and percentage of population with at least 7th grade education in the United States with a correlation coefficient (R) of -0.337 and weighted average of 94.2%, a difference of 1.1%.
7th Grade Correlation Summary
| Measurement | Nepalese | Immigrants from Portugal |
| Minimum | 81.9% | 75.0% |
| Maximum | 99.0% | 100.0% |
| Range | 17.1% | 25.0% |
| Mean | 93.3% | 93.7% |
| Median | 93.6% | 94.1% |
| Interquartile 25% (IQ1) | 91.3% | 91.9% |
| Interquartile 75% (IQ3) | 96.6% | 96.2% |
| Interquartile Range (IQR) | 5.4% | 4.3% |
| Standard Deviation (Sample) | 4.4% | 4.1% |
| Standard Deviation (Population) | 4.3% | 4.1% |
Demographics Similar to Nepalese and Immigrants from Portugal by 7th Grade
In terms of 7th grade, the demographic groups most similar to Nepalese are Central American Indian (93.3%, a difference of 0.11%), Dominican (93.3%, a difference of 0.18%), Immigrants from Belize (93.4%, a difference of 0.19%), Nicaraguan (93.5%, a difference of 0.31%), and Belizean (93.5%, a difference of 0.34%). Similarly, the demographic groups most similar to Immigrants from Portugal are Immigrants from Guyana (94.2%, a difference of 0.020%), Cape Verdean (94.1%, a difference of 0.080%), Ecuadorian (94.0%, a difference of 0.14%), Immigrants from Caribbean (94.0%, a difference of 0.15%), and Puerto Rican (94.0%, a difference of 0.17%).
| Demographics | Rating | Rank | 7th Grade |
| Immigrants | Guyana | 0.0 /100 | #306 | Tragic 94.2% |
| Immigrants | Portugal | 0.0 /100 | #307 | Tragic 94.2% |
| Cape Verdeans | 0.0 /100 | #308 | Tragic 94.1% |
| Ecuadorians | 0.0 /100 | #309 | Tragic 94.0% |
| Immigrants | Caribbean | 0.0 /100 | #310 | Tragic 94.0% |
| Puerto Ricans | 0.0 /100 | #311 | Tragic 94.0% |
| Immigrants | Immigrants | 0.0 /100 | #312 | Tragic 94.0% |
| Immigrants | Bangladesh | 0.0 /100 | #313 | Tragic 94.0% |
| Japanese | 0.0 /100 | #314 | Tragic 94.0% |
| Vietnamese | 0.0 /100 | #315 | Tragic 93.9% |
| Immigrants | Vietnam | 0.0 /100 | #316 | Tragic 93.9% |
| Immigrants | Cuba | 0.0 /100 | #317 | Tragic 93.8% |
| Immigrants | Ecuador | 0.0 /100 | #318 | Tragic 93.7% |
| Immigrants | Cambodia | 0.0 /100 | #319 | Tragic 93.7% |
| Immigrants | Fiji | 0.0 /100 | #320 | Tragic 93.5% |
| Belizeans | 0.0 /100 | #321 | Tragic 93.5% |
| Nicaraguans | 0.0 /100 | #322 | Tragic 93.5% |
| Immigrants | Belize | 0.0 /100 | #323 | Tragic 93.4% |
| Dominicans | 0.0 /100 | #324 | Tragic 93.3% |
| Central American Indians | 0.0 /100 | #325 | Tragic 93.3% |
| Nepalese | 0.0 /100 | #326 | Tragic 93.2% |