Nepalese vs Immigrants from Japan 11th Grade
COMPARE
Nepalese
Immigrants from Japan
11th Grade
11th Grade Comparison
Nepalese
Immigrants from Japan
89.5%
11TH GRADE
0.0/ 100
METRIC RATING
308th/ 347
METRIC RANK
93.8%
11TH GRADE
99.7/ 100
METRIC RATING
72nd/ 347
METRIC RANK
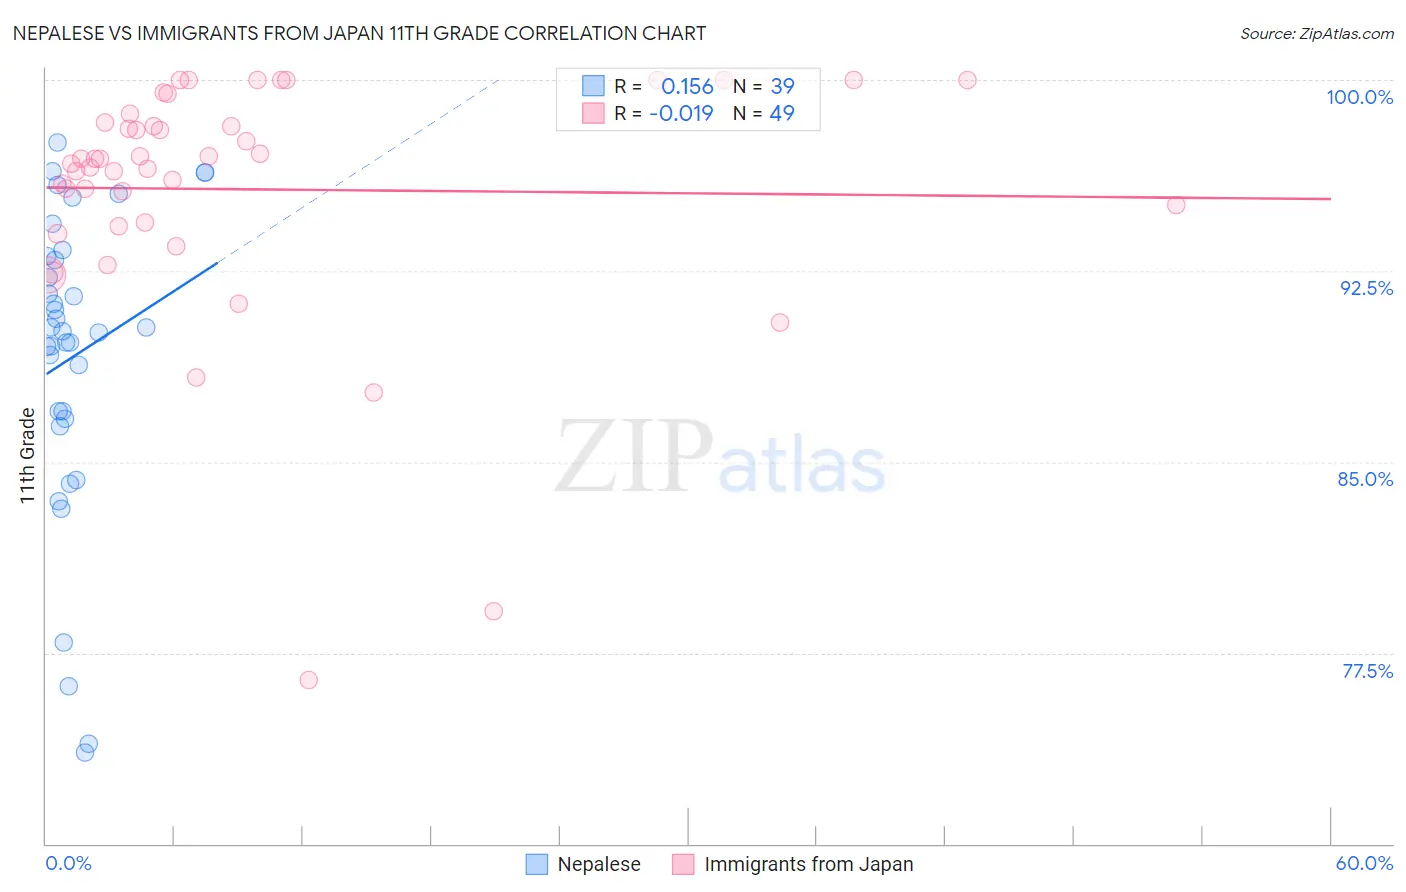
Nepalese vs Immigrants from Japan 11th Grade Correlation Chart
The statistical analysis conducted on geographies consisting of 24,519,269 people shows a poor positive correlation between the proportion of Nepalese and percentage of population with at least 11th grade education in the United States with a correlation coefficient (R) of 0.156 and weighted average of 89.5%. Similarly, the statistical analysis conducted on geographies consisting of 340,148,942 people shows no correlation between the proportion of Immigrants from Japan and percentage of population with at least 11th grade education in the United States with a correlation coefficient (R) of -0.019 and weighted average of 93.8%, a difference of 4.8%.
11th Grade Correlation Summary
| Measurement | Nepalese | Immigrants from Japan |
| Minimum | 73.6% | 76.5% |
| Maximum | 97.6% | 100.0% |
| Range | 24.0% | 23.5% |
| Mean | 89.1% | 95.7% |
| Median | 90.1% | 96.9% |
| Interquartile 25% (IQ1) | 86.7% | 94.3% |
| Interquartile 75% (IQ3) | 93.1% | 98.5% |
| Interquartile Range (IQR) | 6.4% | 4.2% |
| Standard Deviation (Sample) | 6.0% | 4.8% |
| Standard Deviation (Population) | 5.9% | 4.8% |
Similar Demographics by 11th Grade
Demographics Similar to Nepalese by 11th Grade
In terms of 11th grade, the demographic groups most similar to Nepalese are Immigrants from Dominica (89.5%, a difference of 0.020%), Immigrants from Bangladesh (89.5%, a difference of 0.020%), Yaqui (89.5%, a difference of 0.030%), Ecuadorian (89.6%, a difference of 0.070%), and Vietnamese (89.4%, a difference of 0.10%).
| Demographics | Rating | Rank | 11th Grade |
| Guyanese | 0.0 /100 | #301 | Tragic 89.9% |
| Immigrants | Guyana | 0.0 /100 | #302 | Tragic 89.7% |
| Immigrants | Immigrants | 0.0 /100 | #303 | Tragic 89.7% |
| Yuman | 0.0 /100 | #304 | Tragic 89.7% |
| Immigrants | Cambodia | 0.0 /100 | #305 | Tragic 89.6% |
| Ecuadorians | 0.0 /100 | #306 | Tragic 89.6% |
| Immigrants | Dominica | 0.0 /100 | #307 | Tragic 89.5% |
| Nepalese | 0.0 /100 | #308 | Tragic 89.5% |
| Immigrants | Bangladesh | 0.0 /100 | #309 | Tragic 89.5% |
| Yaqui | 0.0 /100 | #310 | Tragic 89.5% |
| Vietnamese | 0.0 /100 | #311 | Tragic 89.4% |
| Immigrants | Portugal | 0.0 /100 | #312 | Tragic 89.3% |
| Immigrants | Caribbean | 0.0 /100 | #313 | Tragic 89.1% |
| Cape Verdeans | 0.0 /100 | #314 | Tragic 89.1% |
| Immigrants | Ecuador | 0.0 /100 | #315 | Tragic 89.1% |
Demographics Similar to Immigrants from Japan by 11th Grade
In terms of 11th grade, the demographic groups most similar to Immigrants from Japan are Romanian (93.8%, a difference of 0.020%), Immigrants from Czechoslovakia (93.8%, a difference of 0.020%), Immigrants from South Africa (93.8%, a difference of 0.030%), Immigrants from England (93.8%, a difference of 0.040%), and Immigrants from Latvia (93.8%, a difference of 0.040%).
| Demographics | Rating | Rank | 11th Grade |
| Native Hawaiians | 99.8 /100 | #65 | Exceptional 93.9% |
| Alaskan Athabascans | 99.8 /100 | #66 | Exceptional 93.9% |
| Immigrants | Netherlands | 99.8 /100 | #67 | Exceptional 93.9% |
| Zimbabweans | 99.8 /100 | #68 | Exceptional 93.9% |
| Scotch-Irish | 99.8 /100 | #69 | Exceptional 93.9% |
| Immigrants | England | 99.7 /100 | #70 | Exceptional 93.8% |
| Immigrants | South Africa | 99.7 /100 | #71 | Exceptional 93.8% |
| Immigrants | Japan | 99.7 /100 | #72 | Exceptional 93.8% |
| Romanians | 99.6 /100 | #73 | Exceptional 93.8% |
| Immigrants | Czechoslovakia | 99.6 /100 | #74 | Exceptional 93.8% |
| Immigrants | Latvia | 99.6 /100 | #75 | Exceptional 93.8% |
| Celtics | 99.5 /100 | #76 | Exceptional 93.7% |
| Aleuts | 99.5 /100 | #77 | Exceptional 93.7% |
| Soviet Union | 99.5 /100 | #78 | Exceptional 93.7% |
| Immigrants | Denmark | 99.5 /100 | #79 | Exceptional 93.7% |