Nepalese vs Immigrants from Albania 2nd Grade
COMPARE
Nepalese
Immigrants from Albania
2nd Grade
2nd Grade Comparison
Nepalese
Immigrants from Albania
96.1%
2ND GRADE
0.0/ 100
METRIC RATING
343rd/ 347
METRIC RANK
97.8%
2ND GRADE
18.4/ 100
METRIC RATING
204th/ 347
METRIC RANK
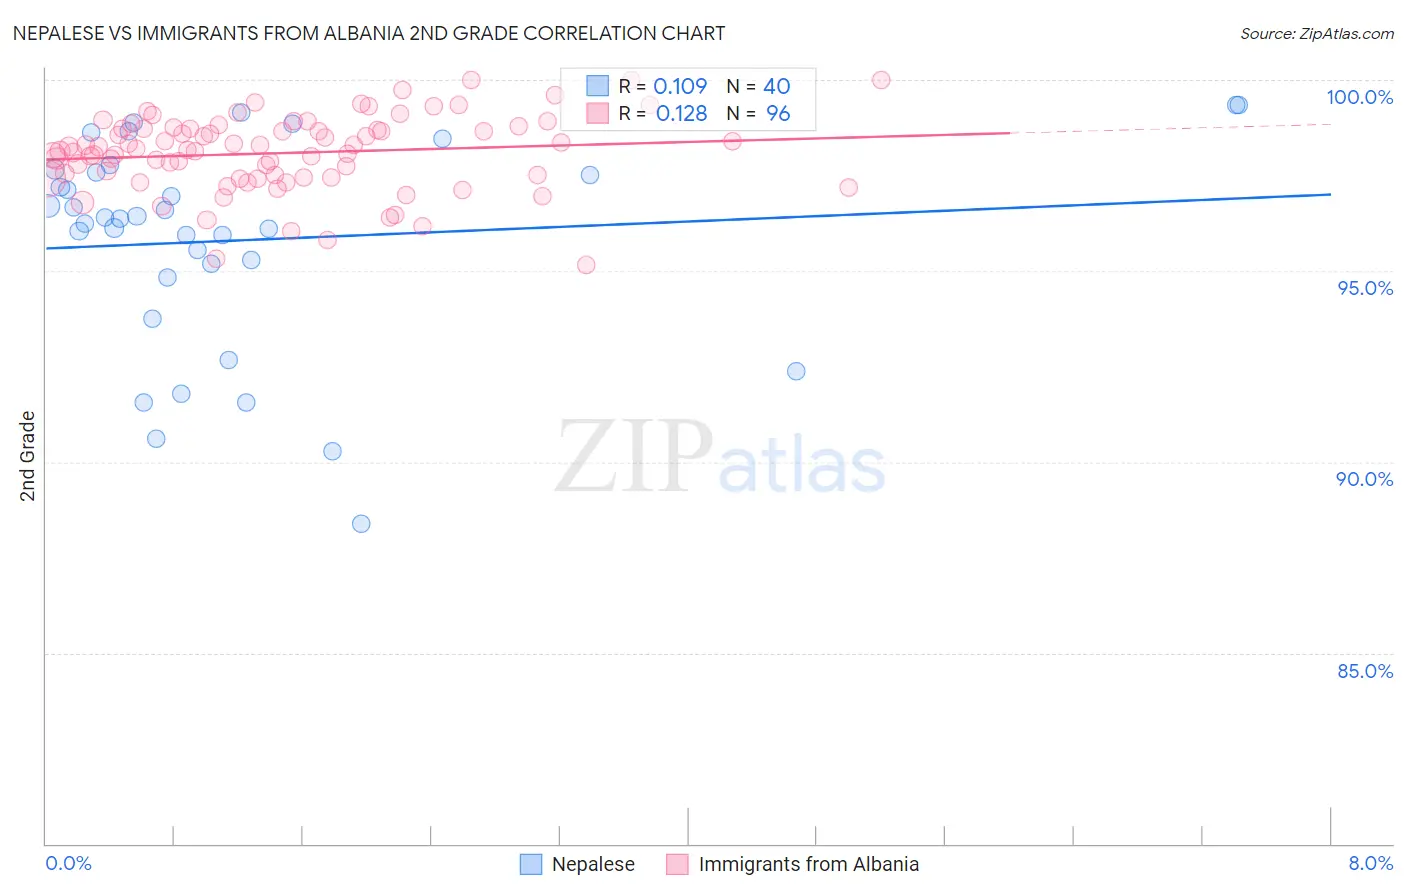
Nepalese vs Immigrants from Albania 2nd Grade Correlation Chart
The statistical analysis conducted on geographies consisting of 24,521,755 people shows a poor positive correlation between the proportion of Nepalese and percentage of population with at least 2nd grade education in the United States with a correlation coefficient (R) of 0.109 and weighted average of 96.1%. Similarly, the statistical analysis conducted on geographies consisting of 119,263,578 people shows a poor positive correlation between the proportion of Immigrants from Albania and percentage of population with at least 2nd grade education in the United States with a correlation coefficient (R) of 0.128 and weighted average of 97.8%, a difference of 1.8%.
2nd Grade Correlation Summary
| Measurement | Nepalese | Immigrants from Albania |
| Minimum | 88.4% | 95.1% |
| Maximum | 99.3% | 100.0% |
| Range | 11.0% | 4.9% |
| Mean | 95.8% | 98.1% |
| Median | 96.4% | 98.2% |
| Interquartile 25% (IQ1) | 95.0% | 97.4% |
| Interquartile 75% (IQ3) | 97.6% | 98.7% |
| Interquartile Range (IQR) | 2.6% | 1.3% |
| Standard Deviation (Sample) | 2.7% | 1.00% |
| Standard Deviation (Population) | 2.7% | 0.99% |
Similar Demographics by 2nd Grade
Demographics Similar to Nepalese by 2nd Grade
In terms of 2nd grade, the demographic groups most similar to Nepalese are Salvadoran (96.0%, a difference of 0.040%), Immigrants from Mexico (96.1%, a difference of 0.090%), Immigrants from Central America (96.2%, a difference of 0.11%), Immigrants from Guatemala (96.2%, a difference of 0.13%), and Immigrants from El Salvador (95.9%, a difference of 0.20%).
| Demographics | Rating | Rank | 2nd Grade |
| Immigrants | Dominican Republic | 0.0 /100 | #333 | Tragic 96.4% |
| Central Americans | 0.0 /100 | #334 | Tragic 96.4% |
| Yakama | 0.0 /100 | #335 | Tragic 96.4% |
| Immigrants | Fiji | 0.0 /100 | #336 | Tragic 96.4% |
| Immigrants | Cambodia | 0.0 /100 | #337 | Tragic 96.4% |
| Immigrants | Cabo Verde | 0.0 /100 | #338 | Tragic 96.3% |
| Guatemalans | 0.0 /100 | #339 | Tragic 96.3% |
| Immigrants | Guatemala | 0.0 /100 | #340 | Tragic 96.2% |
| Immigrants | Central America | 0.0 /100 | #341 | Tragic 96.2% |
| Immigrants | Mexico | 0.0 /100 | #342 | Tragic 96.1% |
| Nepalese | 0.0 /100 | #343 | Tragic 96.1% |
| Salvadorans | 0.0 /100 | #344 | Tragic 96.0% |
| Immigrants | El Salvador | 0.0 /100 | #345 | Tragic 95.9% |
| Immigrants | Yemen | 0.0 /100 | #346 | Tragic 95.7% |
| Spanish American Indians | 0.0 /100 | #347 | Tragic 95.6% |
Demographics Similar to Immigrants from Albania by 2nd Grade
In terms of 2nd grade, the demographic groups most similar to Immigrants from Albania are Immigrants from Southern Europe (97.8%, a difference of 0.0%), Immigrants from Lebanon (97.8%, a difference of 0.010%), Tohono O'odham (97.8%, a difference of 0.010%), Immigrants from Ukraine (97.8%, a difference of 0.010%), and Yuman (97.8%, a difference of 0.010%).
| Demographics | Rating | Rank | 2nd Grade |
| Immigrants | Uganda | 26.3 /100 | #197 | Fair 97.8% |
| Guamanians/Chamorros | 25.7 /100 | #198 | Fair 97.8% |
| Immigrants | Egypt | 24.4 /100 | #199 | Fair 97.8% |
| Immigrants | Lebanon | 20.9 /100 | #200 | Fair 97.8% |
| Tohono O'odham | 20.9 /100 | #201 | Fair 97.8% |
| Immigrants | Ukraine | 20.5 /100 | #202 | Fair 97.8% |
| Yuman | 20.0 /100 | #203 | Fair 97.8% |
| Immigrants | Albania | 18.4 /100 | #204 | Poor 97.8% |
| Immigrants | Southern Europe | 18.1 /100 | #205 | Poor 97.8% |
| Immigrants | Chile | 17.3 /100 | #206 | Poor 97.7% |
| Africans | 15.6 /100 | #207 | Poor 97.7% |
| Immigrants | Northern Africa | 12.3 /100 | #208 | Poor 97.7% |
| Immigrants | Oceania | 10.9 /100 | #209 | Poor 97.7% |
| Costa Ricans | 10.5 /100 | #210 | Poor 97.7% |
| Laotians | 9.9 /100 | #211 | Tragic 97.7% |