Navajo vs Immigrants from Egypt Nursery School
COMPARE
Navajo
Immigrants from Egypt
Nursery School
Nursery School Comparison
Navajo
Immigrants from Egypt
98.0%
NURSERY SCHOOL
50.0/ 100
METRIC RATING
174th/ 347
METRIC RANK
97.9%
NURSERY SCHOOL
22.5/ 100
METRIC RATING
199th/ 347
METRIC RANK
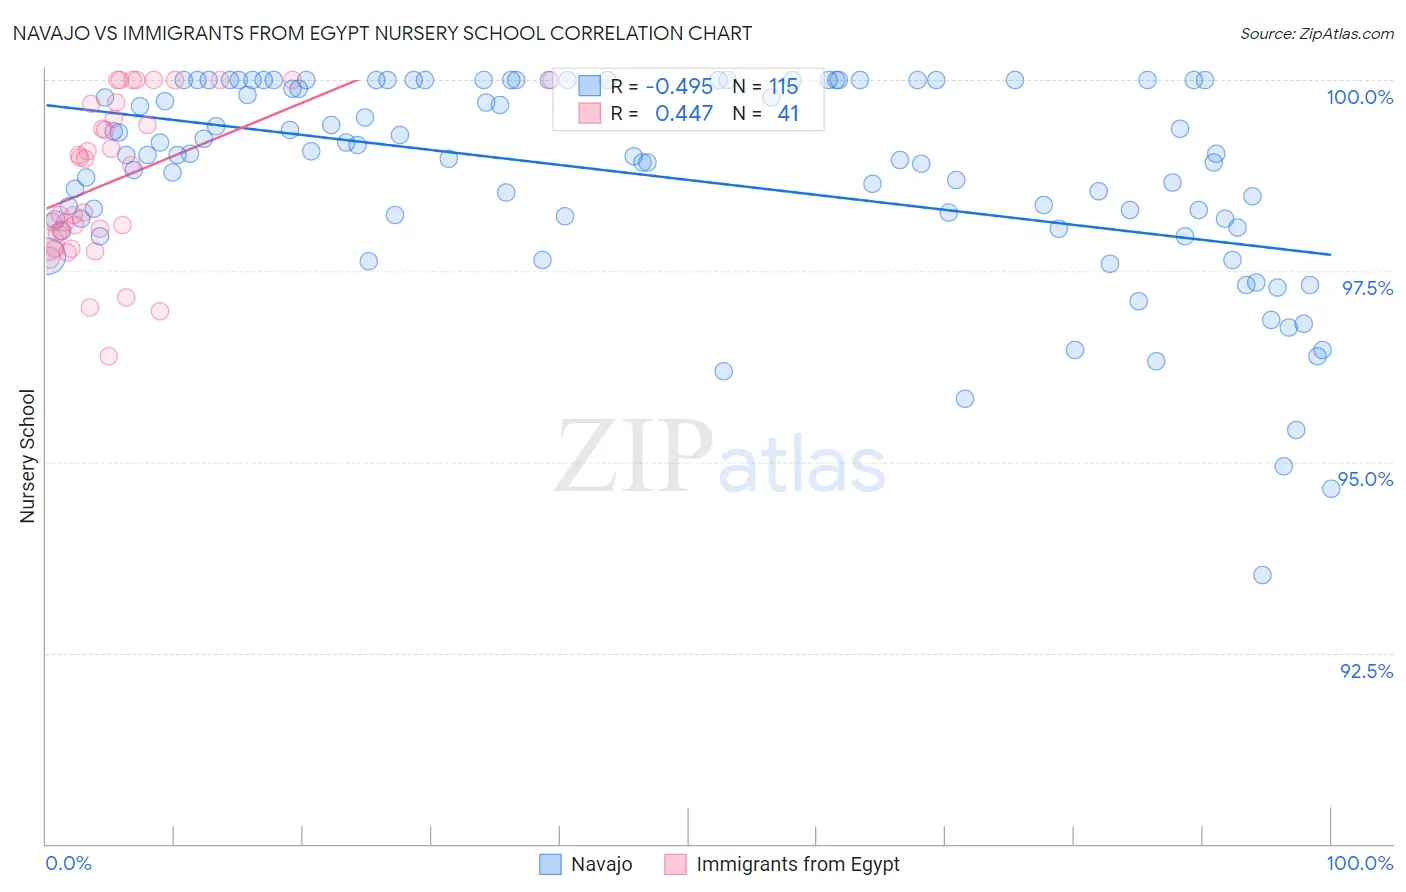
Navajo vs Immigrants from Egypt Nursery School Correlation Chart
The statistical analysis conducted on geographies consisting of 224,872,493 people shows a moderate negative correlation between the proportion of Navajo and percentage of population with at least nursery school education in the United States with a correlation coefficient (R) of -0.495 and weighted average of 98.0%. Similarly, the statistical analysis conducted on geographies consisting of 245,485,794 people shows a moderate positive correlation between the proportion of Immigrants from Egypt and percentage of population with at least nursery school education in the United States with a correlation coefficient (R) of 0.447 and weighted average of 97.9%, a difference of 0.090%.
Nursery School Correlation Summary
| Measurement | Navajo | Immigrants from Egypt |
| Minimum | 93.5% | 96.4% |
| Maximum | 100.0% | 100.0% |
| Range | 6.5% | 3.6% |
| Mean | 98.7% | 98.7% |
| Median | 99.0% | 98.9% |
| Interquartile 25% (IQ1) | 98.2% | 97.9% |
| Interquartile 75% (IQ3) | 100.0% | 99.7% |
| Interquartile Range (IQR) | 1.8% | 1.8% |
| Standard Deviation (Sample) | 1.3% | 1.0% |
| Standard Deviation (Population) | 1.3% | 1.0% |
Similar Demographics by Nursery School
Demographics Similar to Navajo by Nursery School
In terms of nursery school, the demographic groups most similar to Navajo are Immigrants from Brazil (98.0%, a difference of 0.0%), Kenyan (98.0%, a difference of 0.0%), Immigrants from Sri Lanka (98.0%, a difference of 0.0%), Immigrants from Venezuela (98.0%, a difference of 0.0%), and Albanian (98.0%, a difference of 0.0%).
| Demographics | Rating | Rank | Nursery School |
| Immigrants | Spain | 55.6 /100 | #167 | Average 98.0% |
| Immigrants | Micronesia | 55.0 /100 | #168 | Average 98.0% |
| Immigrants | Korea | 53.8 /100 | #169 | Average 98.0% |
| Bermudans | 53.7 /100 | #170 | Average 98.0% |
| Immigrants | Jordan | 53.4 /100 | #171 | Average 98.0% |
| Immigrants | Brazil | 51.3 /100 | #172 | Average 98.0% |
| Kenyans | 50.2 /100 | #173 | Average 98.0% |
| Navajo | 50.0 /100 | #174 | Average 98.0% |
| Immigrants | Sri Lanka | 49.9 /100 | #175 | Average 98.0% |
| Immigrants | Venezuela | 49.8 /100 | #176 | Average 98.0% |
| Albanians | 48.9 /100 | #177 | Average 98.0% |
| Natives/Alaskans | 48.6 /100 | #178 | Average 98.0% |
| Argentineans | 46.8 /100 | #179 | Average 98.0% |
| Immigrants | Bosnia and Herzegovina | 45.6 /100 | #180 | Average 98.0% |
| Egyptians | 42.8 /100 | #181 | Average 98.0% |
Demographics Similar to Immigrants from Egypt by Nursery School
In terms of nursery school, the demographic groups most similar to Immigrants from Egypt are Tohono O'odham (97.9%, a difference of 0.0%), Guamanian/Chamorro (97.9%, a difference of 0.010%), Yuman (97.9%, a difference of 0.010%), Immigrants from Kenya (97.9%, a difference of 0.010%), and Immigrants from Lebanon (97.9%, a difference of 0.010%).
| Demographics | Rating | Rank | Nursery School |
| Blacks/African Americans | 29.4 /100 | #192 | Fair 97.9% |
| Paraguayans | 27.4 /100 | #193 | Fair 97.9% |
| Mongolians | 27.3 /100 | #194 | Fair 97.9% |
| Hawaiians | 27.2 /100 | #195 | Fair 97.9% |
| Guamanians/Chamorros | 25.7 /100 | #196 | Fair 97.9% |
| Yuman | 25.7 /100 | #197 | Fair 97.9% |
| Immigrants | Kenya | 24.1 /100 | #198 | Fair 97.9% |
| Immigrants | Egypt | 22.5 /100 | #199 | Fair 97.9% |
| Tohono O'odham | 22.2 /100 | #200 | Fair 97.9% |
| Immigrants | Lebanon | 21.2 /100 | #201 | Fair 97.9% |
| Immigrants | Ukraine | 19.9 /100 | #202 | Poor 97.9% |
| Immigrants | Uganda | 18.0 /100 | #203 | Poor 97.9% |
| Immigrants | Southern Europe | 17.4 /100 | #204 | Poor 97.9% |
| Immigrants | Chile | 17.3 /100 | #205 | Poor 97.9% |
| Immigrants | Albania | 16.4 /100 | #206 | Poor 97.9% |