Native/Alaskan vs Laotian 12th Grade, No Diploma
COMPARE
Native/Alaskan
Laotian
12th Grade, No Diploma
12th Grade, No Diploma Comparison
Natives/Alaskans
Laotians
87.7%
12TH GRADE, NO DIPLOMA
0.0/ 100
METRIC RATING
306th/ 347
METRIC RANK
91.3%
12TH GRADE, NO DIPLOMA
64.4/ 100
METRIC RATING
159th/ 347
METRIC RANK
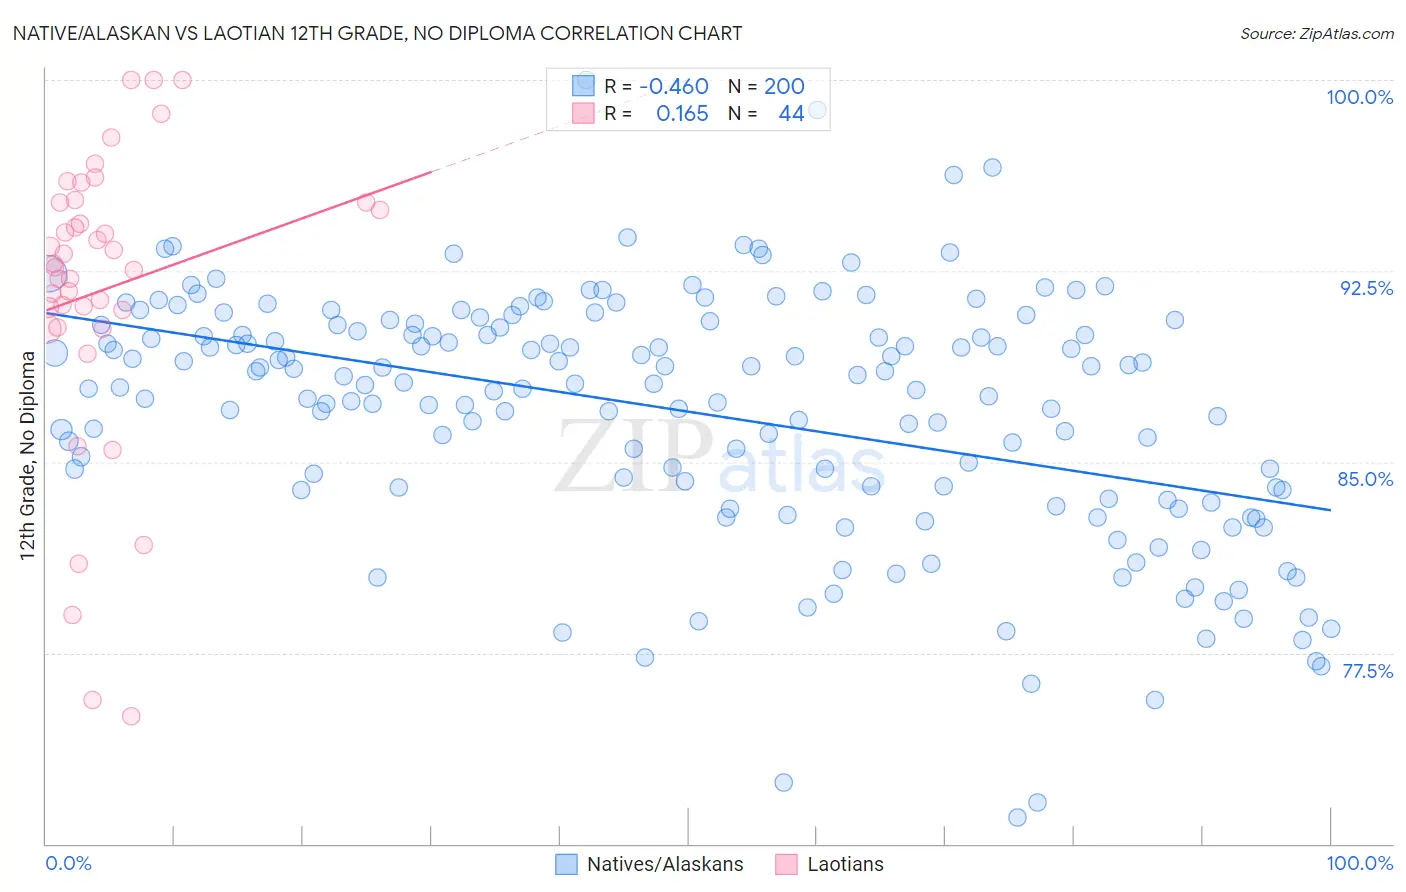
Native/Alaskan vs Laotian 12th Grade, No Diploma Correlation Chart
The statistical analysis conducted on geographies consisting of 513,075,812 people shows a moderate negative correlation between the proportion of Natives/Alaskans and percentage of population with at least 12th grade (no diploma) education in the United States with a correlation coefficient (R) of -0.460 and weighted average of 87.7%. Similarly, the statistical analysis conducted on geographies consisting of 224,854,130 people shows a poor positive correlation between the proportion of Laotians and percentage of population with at least 12th grade (no diploma) education in the United States with a correlation coefficient (R) of 0.165 and weighted average of 91.3%, a difference of 4.2%.
12th Grade, No Diploma Correlation Summary
| Measurement | Native/Alaskan | Laotian |
| Minimum | 71.1% | 75.0% |
| Maximum | 100.0% | 100.0% |
| Range | 28.9% | 25.0% |
| Mean | 87.0% | 91.7% |
| Median | 88.1% | 92.7% |
| Interquartile 25% (IQ1) | 83.9% | 90.6% |
| Interquartile 75% (IQ3) | 90.3% | 95.2% |
| Interquartile Range (IQR) | 6.4% | 4.6% |
| Standard Deviation (Sample) | 4.9% | 5.8% |
| Standard Deviation (Population) | 4.9% | 5.8% |
Similar Demographics by 12th Grade, No Diploma
Demographics Similar to Natives/Alaskans by 12th Grade, No Diploma
In terms of 12th grade, no diploma, the demographic groups most similar to Natives/Alaskans are Immigrants from Portugal (87.6%, a difference of 0.040%), Immigrants from Dominica (87.7%, a difference of 0.070%), Yup'ik (87.6%, a difference of 0.080%), Immigrants from Armenia (87.6%, a difference of 0.11%), and Immigrants from Cuba (87.5%, a difference of 0.16%).
| Demographics | Rating | Rank | 12th Grade, No Diploma |
| Nepalese | 0.0 /100 | #299 | Tragic 88.1% |
| Immigrants | Guyana | 0.0 /100 | #300 | Tragic 88.1% |
| Immigrants | Cambodia | 0.0 /100 | #301 | Tragic 88.1% |
| Ecuadorians | 0.0 /100 | #302 | Tragic 88.0% |
| Immigrants | Bangladesh | 0.0 /100 | #303 | Tragic 88.0% |
| Vietnamese | 0.0 /100 | #304 | Tragic 87.9% |
| Immigrants | Dominica | 0.0 /100 | #305 | Tragic 87.7% |
| Natives/Alaskans | 0.0 /100 | #306 | Tragic 87.7% |
| Immigrants | Portugal | 0.0 /100 | #307 | Tragic 87.6% |
| Yup'ik | 0.0 /100 | #308 | Tragic 87.6% |
| Immigrants | Armenia | 0.0 /100 | #309 | Tragic 87.6% |
| Immigrants | Cuba | 0.0 /100 | #310 | Tragic 87.5% |
| Yaqui | 0.0 /100 | #311 | Tragic 87.5% |
| Immigrants | Ecuador | 0.0 /100 | #312 | Tragic 87.5% |
| Immigrants | Caribbean | 0.0 /100 | #313 | Tragic 87.4% |
Demographics Similar to Laotians by 12th Grade, No Diploma
In terms of 12th grade, no diploma, the demographic groups most similar to Laotians are Immigrants from Albania (91.3%, a difference of 0.0%), Immigrants from Hong Kong (91.3%, a difference of 0.010%), Immigrants from Northern Africa (91.4%, a difference of 0.020%), Brazilian (91.3%, a difference of 0.030%), and Immigrants from Asia (91.3%, a difference of 0.040%).
| Demographics | Rating | Rank | 12th Grade, No Diploma |
| Kenyans | 77.4 /100 | #152 | Good 91.5% |
| Iraqis | 75.3 /100 | #153 | Good 91.5% |
| Immigrants | Kenya | 73.9 /100 | #154 | Good 91.5% |
| Immigrants | Iraq | 73.0 /100 | #155 | Good 91.4% |
| Asians | 71.9 /100 | #156 | Good 91.4% |
| Immigrants | Pakistan | 70.7 /100 | #157 | Good 91.4% |
| Immigrants | Northern Africa | 66.2 /100 | #158 | Good 91.4% |
| Laotians | 64.4 /100 | #159 | Good 91.3% |
| Immigrants | Albania | 64.1 /100 | #160 | Good 91.3% |
| Immigrants | Hong Kong | 63.8 /100 | #161 | Good 91.3% |
| Brazilians | 62.0 /100 | #162 | Good 91.3% |
| Immigrants | Asia | 61.5 /100 | #163 | Good 91.3% |
| Immigrants | China | 60.9 /100 | #164 | Good 91.3% |
| Alsatians | 58.3 /100 | #165 | Average 91.3% |
| Hmong | 58.0 /100 | #166 | Average 91.3% |