Native/Alaskan vs Immigrants from South Africa No Schooling Completed
COMPARE
Native/Alaskan
Immigrants from South Africa
No Schooling Completed
No Schooling Completed Comparison
Natives/Alaskans
Immigrants from South Africa
2.2%
NO SCHOOLING COMPLETED
10.0/ 100
METRIC RATING
210th/ 347
METRIC RANK
1.7%
NO SCHOOLING COMPLETED
99.3/ 100
METRIC RATING
82nd/ 347
METRIC RANK
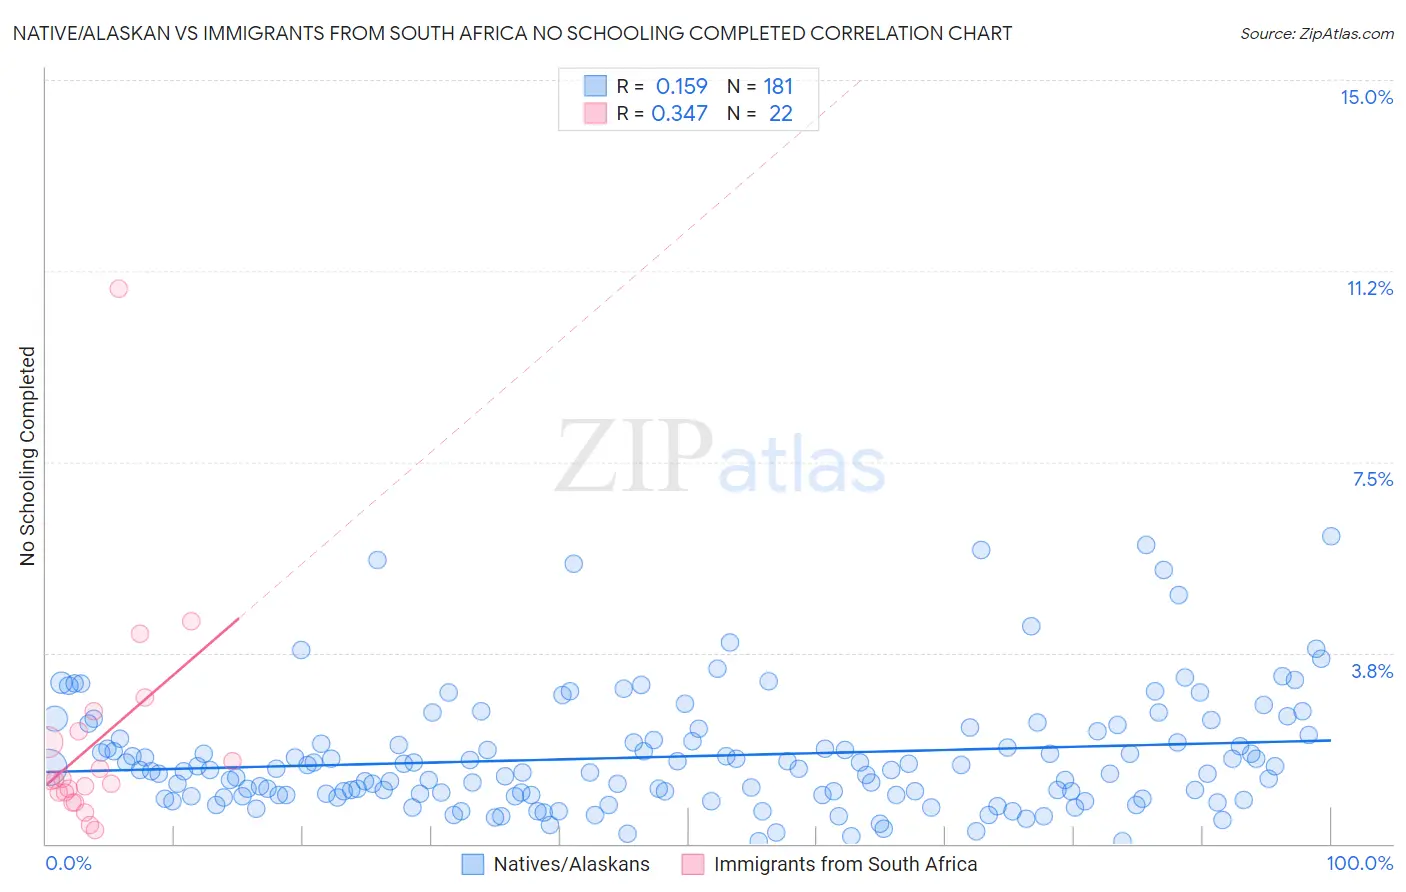
Native/Alaskan vs Immigrants from South Africa No Schooling Completed Correlation Chart
The statistical analysis conducted on geographies consisting of 503,675,211 people shows a poor positive correlation between the proportion of Natives/Alaskans and percentage of population with no schooling in the United States with a correlation coefficient (R) of 0.159 and weighted average of 2.2%. Similarly, the statistical analysis conducted on geographies consisting of 231,709,438 people shows a mild positive correlation between the proportion of Immigrants from South Africa and percentage of population with no schooling in the United States with a correlation coefficient (R) of 0.347 and weighted average of 1.7%, a difference of 28.6%.
No Schooling Completed Correlation Summary
| Measurement | Native/Alaskan | Immigrants from South Africa |
| Minimum | 0.041% | 0.28% |
| Maximum | 6.0% | 10.9% |
| Range | 6.0% | 10.6% |
| Mean | 1.7% | 2.0% |
| Median | 1.4% | 1.2% |
| Interquartile 25% (IQ1) | 0.96% | 1.0% |
| Interquartile 75% (IQ3) | 2.1% | 2.2% |
| Interquartile Range (IQR) | 1.1% | 1.2% |
| Standard Deviation (Sample) | 1.2% | 2.3% |
| Standard Deviation (Population) | 1.2% | 2.2% |
Similar Demographics by No Schooling Completed
Demographics Similar to Natives/Alaskans by No Schooling Completed
In terms of no schooling completed, the demographic groups most similar to Natives/Alaskans are Immigrants from Oceania (2.2%, a difference of 0.070%), South American Indian (2.2%, a difference of 0.33%), Uruguayan (2.2%, a difference of 0.33%), Immigrants from Panama (2.3%, a difference of 0.45%), and Immigrants from Morocco (2.3%, a difference of 0.46%).
| Demographics | Rating | Rank | No Schooling Completed |
| Laotians | 13.3 /100 | #203 | Poor 2.2% |
| Hopi | 12.9 /100 | #204 | Poor 2.2% |
| Immigrants | Bahamas | 11.6 /100 | #205 | Poor 2.2% |
| Bahamians | 11.6 /100 | #206 | Poor 2.2% |
| South American Indians | 11.0 /100 | #207 | Poor 2.2% |
| Uruguayans | 11.0 /100 | #208 | Poor 2.2% |
| Immigrants | Oceania | 10.2 /100 | #209 | Poor 2.2% |
| Natives/Alaskans | 10.0 /100 | #210 | Tragic 2.2% |
| Immigrants | Panama | 8.8 /100 | #211 | Tragic 2.3% |
| Immigrants | Morocco | 8.7 /100 | #212 | Tragic 2.3% |
| Ute | 8.2 /100 | #213 | Tragic 2.3% |
| Samoans | 8.2 /100 | #214 | Tragic 2.3% |
| Immigrants | Zaire | 7.2 /100 | #215 | Tragic 2.3% |
| Tongans | 6.8 /100 | #216 | Tragic 2.3% |
| Immigrants | Syria | 6.6 /100 | #217 | Tragic 2.3% |
Demographics Similar to Immigrants from South Africa by No Schooling Completed
In terms of no schooling completed, the demographic groups most similar to Immigrants from South Africa are Icelander (1.7%, a difference of 0.090%), Potawatomi (1.7%, a difference of 0.11%), Cypriot (1.7%, a difference of 0.13%), Macedonian (1.7%, a difference of 0.14%), and Immigrants from Denmark (1.7%, a difference of 0.16%).
| Demographics | Rating | Rank | No Schooling Completed |
| Immigrants | Belgium | 99.3 /100 | #75 | Exceptional 1.7% |
| Cherokee | 99.3 /100 | #76 | Exceptional 1.7% |
| Immigrants | Sweden | 99.3 /100 | #77 | Exceptional 1.7% |
| Delaware | 99.3 /100 | #78 | Exceptional 1.7% |
| Macedonians | 99.3 /100 | #79 | Exceptional 1.7% |
| Cypriots | 99.3 /100 | #80 | Exceptional 1.7% |
| Icelanders | 99.3 /100 | #81 | Exceptional 1.7% |
| Immigrants | South Africa | 99.3 /100 | #82 | Exceptional 1.7% |
| Potawatomi | 99.3 /100 | #83 | Exceptional 1.7% |
| Immigrants | Denmark | 99.2 /100 | #84 | Exceptional 1.7% |
| Immigrants | Australia | 99.2 /100 | #85 | Exceptional 1.7% |
| Ukrainians | 99.2 /100 | #86 | Exceptional 1.8% |
| Osage | 99.2 /100 | #87 | Exceptional 1.8% |
| Immigrants | Western Europe | 99.2 /100 | #88 | Exceptional 1.8% |
| South Africans | 99.1 /100 | #89 | Exceptional 1.8% |