Native/Alaskan vs Immigrants from Laos 6th Grade
COMPARE
Native/Alaskan
Immigrants from Laos
6th Grade
6th Grade Comparison
Natives/Alaskans
Immigrants from Laos
96.8%
6TH GRADE
13.0/ 100
METRIC RATING
205th/ 347
METRIC RANK
95.7%
6TH GRADE
0.0/ 100
METRIC RATING
299th/ 347
METRIC RANK
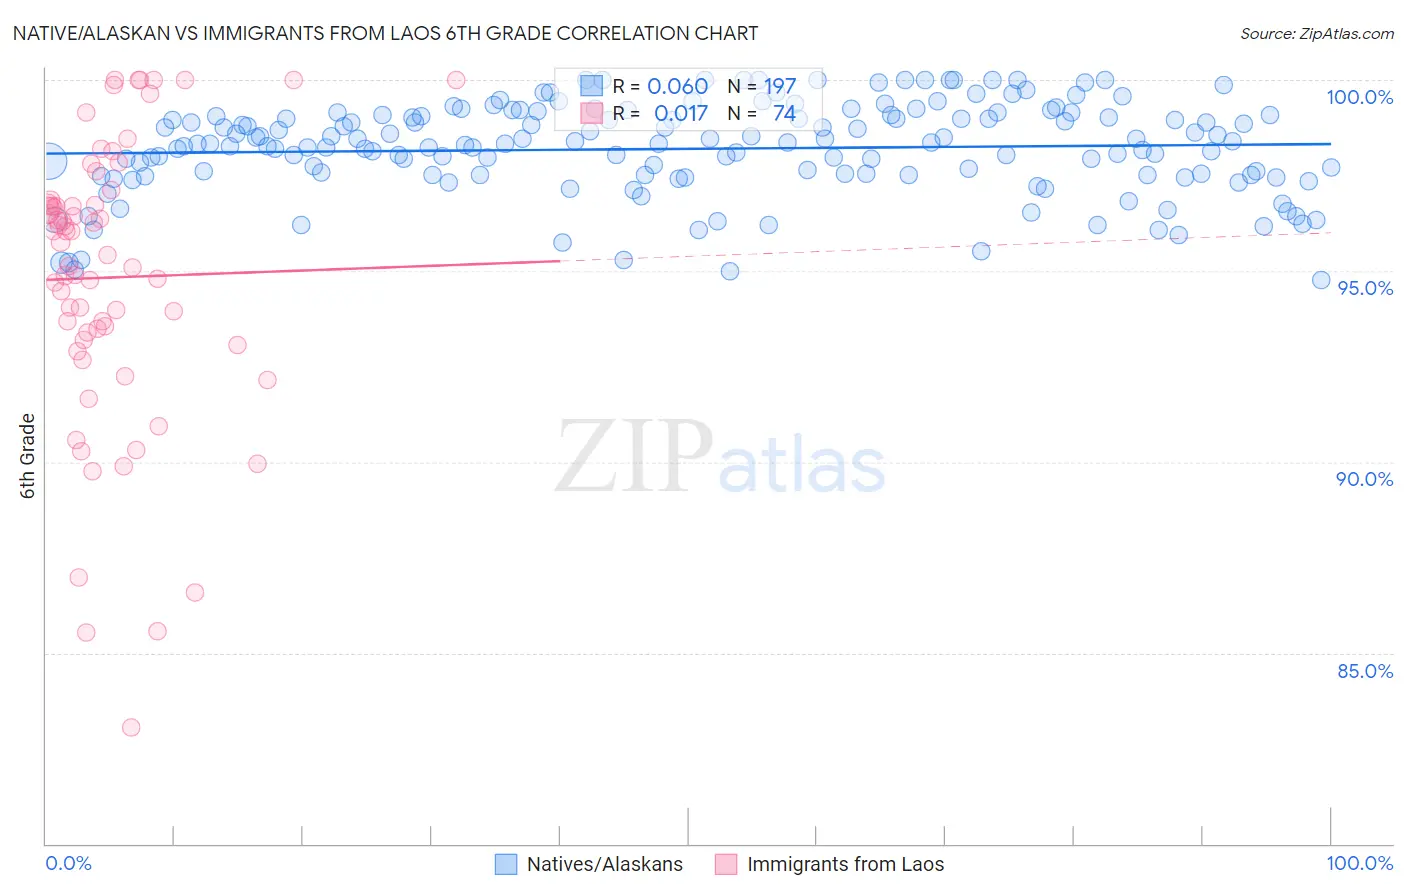
Native/Alaskan vs Immigrants from Laos 6th Grade Correlation Chart
The statistical analysis conducted on geographies consisting of 513,056,654 people shows a slight positive correlation between the proportion of Natives/Alaskans and percentage of population with at least 6th grade education in the United States with a correlation coefficient (R) of 0.060 and weighted average of 96.8%. Similarly, the statistical analysis conducted on geographies consisting of 201,472,886 people shows no correlation between the proportion of Immigrants from Laos and percentage of population with at least 6th grade education in the United States with a correlation coefficient (R) of 0.017 and weighted average of 95.7%, a difference of 1.1%.
6th Grade Correlation Summary
| Measurement | Native/Alaskan | Immigrants from Laos |
| Minimum | 94.8% | 83.0% |
| Maximum | 100.0% | 100.0% |
| Range | 5.2% | 17.0% |
| Mean | 98.2% | 94.8% |
| Median | 98.3% | 95.6% |
| Interquartile 25% (IQ1) | 97.5% | 93.2% |
| Interquartile 75% (IQ3) | 99.1% | 96.8% |
| Interquartile Range (IQR) | 1.6% | 3.6% |
| Standard Deviation (Sample) | 1.2% | 3.7% |
| Standard Deviation (Population) | 1.2% | 3.7% |
Similar Demographics by 6th Grade
Demographics Similar to Natives/Alaskans by 6th Grade
In terms of 6th grade, the demographic groups most similar to Natives/Alaskans are Immigrants from Zaire (96.9%, a difference of 0.010%), Immigrants from Chile (96.8%, a difference of 0.010%), Sudanese (96.8%, a difference of 0.010%), Immigrants from Bahamas (96.8%, a difference of 0.010%), and Laotian (96.8%, a difference of 0.010%).
| Demographics | Rating | Rank | 6th Grade |
| Immigrants | Albania | 18.8 /100 | #198 | Poor 96.9% |
| Immigrants | Northern Africa | 15.7 /100 | #199 | Poor 96.9% |
| Africans | 14.8 /100 | #200 | Poor 96.9% |
| Immigrants | Zaire | 14.5 /100 | #201 | Poor 96.9% |
| Immigrants | Chile | 14.2 /100 | #202 | Poor 96.8% |
| Sudanese | 13.9 /100 | #203 | Poor 96.8% |
| Immigrants | Bahamas | 13.8 /100 | #204 | Poor 96.8% |
| Natives/Alaskans | 13.0 /100 | #205 | Poor 96.8% |
| Laotians | 11.8 /100 | #206 | Poor 96.8% |
| Iraqis | 11.7 /100 | #207 | Poor 96.8% |
| Samoans | 11.0 /100 | #208 | Poor 96.8% |
| Immigrants | Oceania | 11.0 /100 | #209 | Poor 96.8% |
| Immigrants | Nepal | 10.1 /100 | #210 | Poor 96.8% |
| Immigrants | Iraq | 9.2 /100 | #211 | Tragic 96.8% |
| Moroccans | 9.0 /100 | #212 | Tragic 96.8% |
Demographics Similar to Immigrants from Laos by 6th Grade
In terms of 6th grade, the demographic groups most similar to Immigrants from Laos are Immigrants from Dominica (95.7%, a difference of 0.010%), Sri Lankan (95.8%, a difference of 0.020%), Immigrants (95.7%, a difference of 0.020%), Immigrants from Burma/Myanmar (95.7%, a difference of 0.030%), and Haitian (95.8%, a difference of 0.080%).
| Demographics | Rating | Rank | 6th Grade |
| Immigrants | Barbados | 0.0 /100 | #292 | Tragic 96.1% |
| Immigrants | West Indies | 0.0 /100 | #293 | Tragic 96.1% |
| British West Indians | 0.0 /100 | #294 | Tragic 96.0% |
| Immigrants | Grenada | 0.0 /100 | #295 | Tragic 95.9% |
| Immigrants | South Eastern Asia | 0.0 /100 | #296 | Tragic 95.9% |
| Haitians | 0.0 /100 | #297 | Tragic 95.8% |
| Sri Lankans | 0.0 /100 | #298 | Tragic 95.8% |
| Immigrants | Laos | 0.0 /100 | #299 | Tragic 95.7% |
| Immigrants | Dominica | 0.0 /100 | #300 | Tragic 95.7% |
| Immigrants | Immigrants | 0.0 /100 | #301 | Tragic 95.7% |
| Immigrants | Burma/Myanmar | 0.0 /100 | #302 | Tragic 95.7% |
| Bangladeshis | 0.0 /100 | #303 | Tragic 95.7% |
| Indonesians | 0.0 /100 | #304 | Tragic 95.6% |
| Immigrants | Cuba | 0.0 /100 | #305 | Tragic 95.6% |
| Immigrants | Haiti | 0.0 /100 | #306 | Tragic 95.6% |