Native Hawaiian vs Argentinean 7th Grade
COMPARE
Native Hawaiian
Argentinean
7th Grade
7th Grade Comparison
Native Hawaiians
Argentineans
96.9%
7TH GRADE
99.7/ 100
METRIC RATING
67th/ 347
METRIC RANK
95.9%
7TH GRADE
23.2/ 100
METRIC RATING
200th/ 347
METRIC RANK
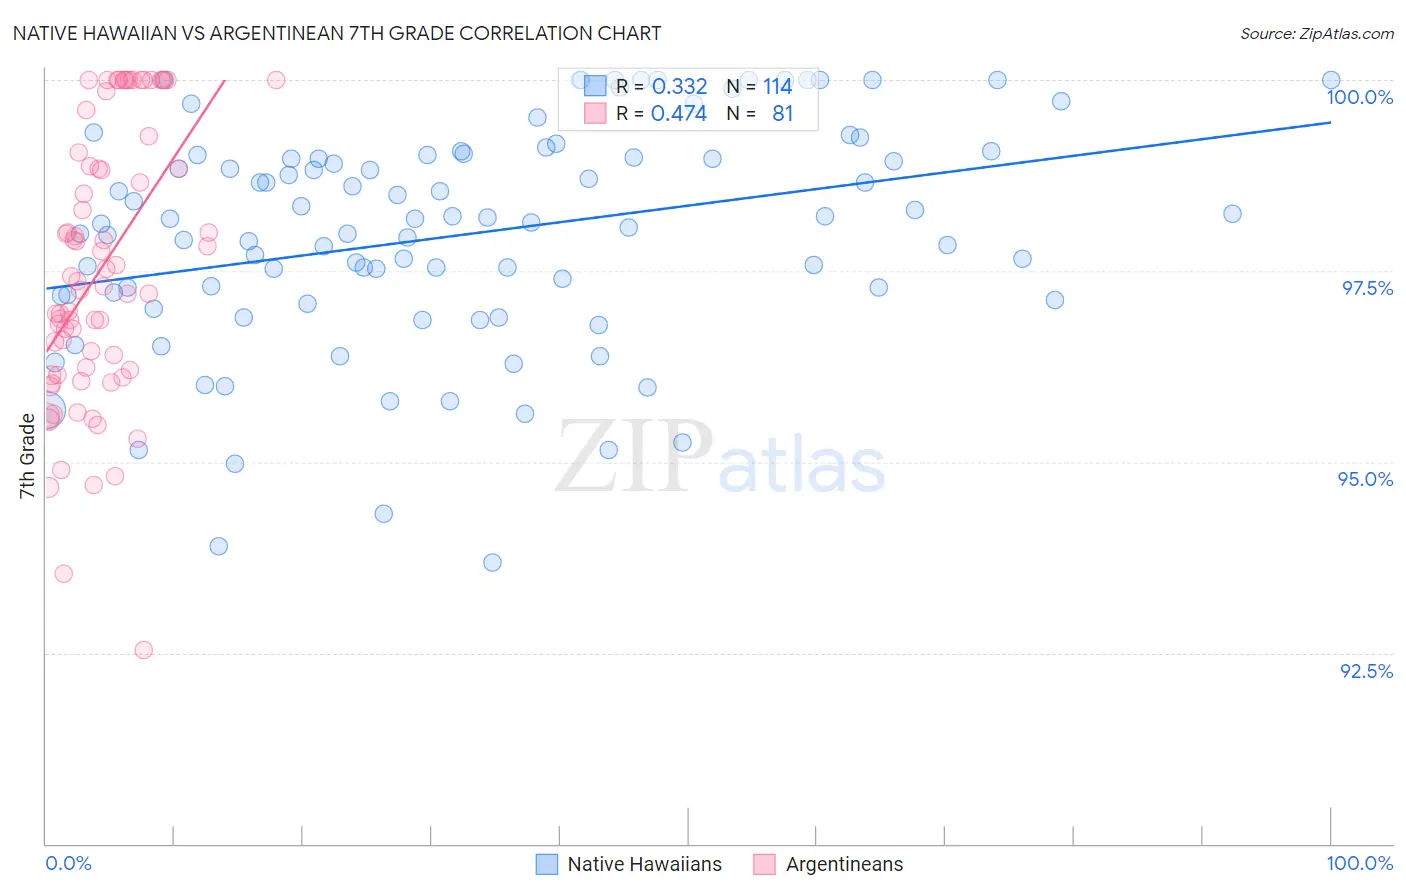
Native Hawaiian vs Argentinean 7th Grade Correlation Chart
The statistical analysis conducted on geographies consisting of 332,101,429 people shows a mild positive correlation between the proportion of Native Hawaiians and percentage of population with at least 7th grade education in the United States with a correlation coefficient (R) of 0.332 and weighted average of 96.9%. Similarly, the statistical analysis conducted on geographies consisting of 297,141,515 people shows a moderate positive correlation between the proportion of Argentineans and percentage of population with at least 7th grade education in the United States with a correlation coefficient (R) of 0.474 and weighted average of 95.9%, a difference of 1.1%.
7th Grade Correlation Summary
| Measurement | Native Hawaiian | Argentinean |
| Minimum | 93.7% | 92.5% |
| Maximum | 100.0% | 100.0% |
| Range | 6.3% | 7.5% |
| Mean | 98.0% | 97.6% |
| Median | 98.2% | 97.4% |
| Interquartile 25% (IQ1) | 97.2% | 96.2% |
| Interquartile 75% (IQ3) | 99.0% | 99.2% |
| Interquartile Range (IQR) | 1.8% | 3.0% |
| Standard Deviation (Sample) | 1.5% | 1.8% |
| Standard Deviation (Population) | 1.5% | 1.8% |
Similar Demographics by 7th Grade
Demographics Similar to Native Hawaiians by 7th Grade
In terms of 7th grade, the demographic groups most similar to Native Hawaiians are Ukrainian (96.9%, a difference of 0.0%), Immigrants from Austria (96.9%, a difference of 0.020%), Canadian (96.9%, a difference of 0.020%), Immigrants from India (96.9%, a difference of 0.020%), and Immigrants from Northern Europe (96.9%, a difference of 0.030%).
| Demographics | Rating | Rank | 7th Grade |
| Immigrants | Canada | 99.8 /100 | #60 | Exceptional 96.9% |
| Creek | 99.8 /100 | #61 | Exceptional 96.9% |
| Immigrants | North America | 99.8 /100 | #62 | Exceptional 96.9% |
| Immigrants | Northern Europe | 99.7 /100 | #63 | Exceptional 96.9% |
| Immigrants | Austria | 99.7 /100 | #64 | Exceptional 96.9% |
| Canadians | 99.7 /100 | #65 | Exceptional 96.9% |
| Ukrainians | 99.7 /100 | #66 | Exceptional 96.9% |
| Native Hawaiians | 99.7 /100 | #67 | Exceptional 96.9% |
| Immigrants | India | 99.6 /100 | #68 | Exceptional 96.9% |
| Iranians | 99.6 /100 | #69 | Exceptional 96.8% |
| New Zealanders | 99.6 /100 | #70 | Exceptional 96.8% |
| Immigrants | Lithuania | 99.6 /100 | #71 | Exceptional 96.8% |
| Cajuns | 99.5 /100 | #72 | Exceptional 96.8% |
| Arapaho | 99.5 /100 | #73 | Exceptional 96.8% |
| Immigrants | England | 99.5 /100 | #74 | Exceptional 96.8% |
Demographics Similar to Argentineans by 7th Grade
In terms of 7th grade, the demographic groups most similar to Argentineans are Guamanian/Chamorro (95.9%, a difference of 0.0%), Paraguayan (95.9%, a difference of 0.010%), Immigrants from Argentina (95.9%, a difference of 0.010%), Immigrants from Northern Africa (95.8%, a difference of 0.020%), and Comanche (95.8%, a difference of 0.020%).
| Demographics | Rating | Rank | 7th Grade |
| Immigrants | Bahamas | 30.8 /100 | #193 | Fair 95.9% |
| Immigrants | Nepal | 30.0 /100 | #194 | Fair 95.9% |
| Sudanese | 28.1 /100 | #195 | Fair 95.9% |
| Apache | 27.6 /100 | #196 | Fair 95.9% |
| Immigrants | Zaire | 26.7 /100 | #197 | Fair 95.9% |
| Paraguayans | 24.8 /100 | #198 | Fair 95.9% |
| Guamanians/Chamorros | 23.5 /100 | #199 | Fair 95.9% |
| Argentineans | 23.2 /100 | #200 | Fair 95.9% |
| Immigrants | Argentina | 21.9 /100 | #201 | Fair 95.9% |
| Immigrants | Northern Africa | 21.4 /100 | #202 | Fair 95.8% |
| Comanche | 21.1 /100 | #203 | Fair 95.8% |
| Assyrians/Chaldeans/Syriacs | 20.5 /100 | #204 | Fair 95.8% |
| Moroccans | 18.9 /100 | #205 | Poor 95.8% |
| Africans | 17.6 /100 | #206 | Poor 95.8% |
| Navajo | 17.0 /100 | #207 | Poor 95.8% |