Moroccan vs Paiute Bachelor's Degree
COMPARE
Moroccan
Paiute
Bachelor's Degree
Bachelor's Degree Comparison
Moroccans
Paiute
40.5%
BACHELOR'S DEGREE
94.6/ 100
METRIC RATING
121st/ 347
METRIC RANK
28.1%
BACHELOR'S DEGREE
0.0/ 100
METRIC RATING
327th/ 347
METRIC RANK
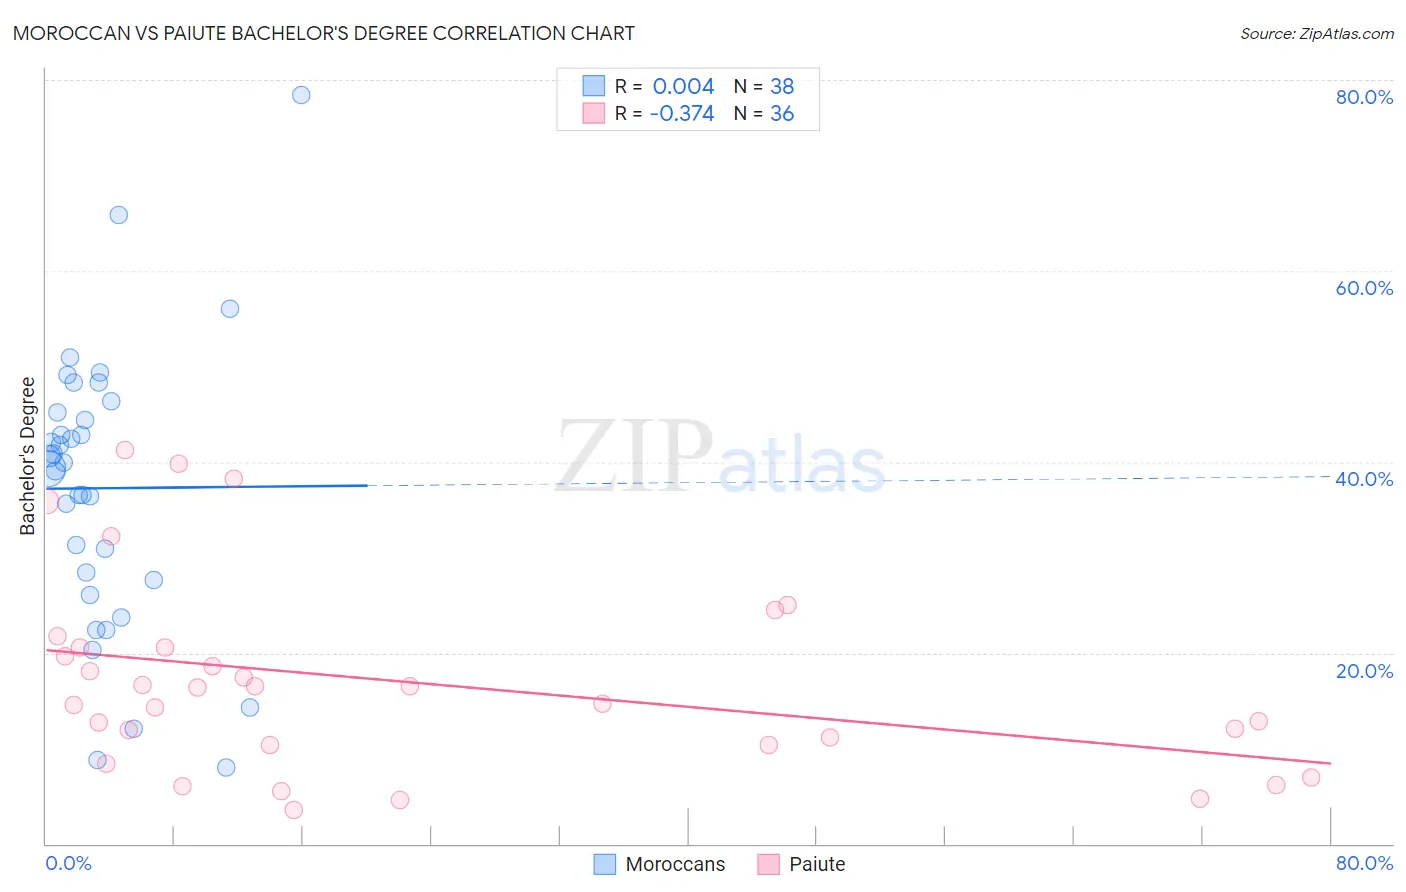
Moroccan vs Paiute Bachelor's Degree Correlation Chart
The statistical analysis conducted on geographies consisting of 201,813,734 people shows no correlation between the proportion of Moroccans and percentage of population with at least bachelor's degree education in the United States with a correlation coefficient (R) of 0.004 and weighted average of 40.5%. Similarly, the statistical analysis conducted on geographies consisting of 58,403,088 people shows a mild negative correlation between the proportion of Paiute and percentage of population with at least bachelor's degree education in the United States with a correlation coefficient (R) of -0.374 and weighted average of 28.1%, a difference of 44.0%.
Bachelor's Degree Correlation Summary
| Measurement | Moroccan | Paiute |
| Minimum | 7.9% | 3.5% |
| Maximum | 78.5% | 41.3% |
| Range | 70.5% | 37.8% |
| Mean | 37.2% | 16.9% |
| Median | 39.6% | 15.5% |
| Interquartile 25% (IQ1) | 27.6% | 10.3% |
| Interquartile 75% (IQ3) | 45.2% | 20.6% |
| Interquartile Range (IQR) | 17.6% | 10.2% |
| Standard Deviation (Sample) | 14.8% | 10.1% |
| Standard Deviation (Population) | 14.6% | 10.0% |
Similar Demographics by Bachelor's Degree
Demographics Similar to Moroccans by Bachelor's Degree
In terms of bachelor's degree, the demographic groups most similar to Moroccans are Venezuelan (40.5%, a difference of 0.050%), Immigrants from Albania (40.4%, a difference of 0.10%), Immigrants from Syria (40.5%, a difference of 0.12%), Lebanese (40.4%, a difference of 0.12%), and Immigrants from Eritrea (40.4%, a difference of 0.12%).
| Demographics | Rating | Rank | Bachelor's Degree |
| Afghans | 96.2 /100 | #114 | Exceptional 40.8% |
| Palestinians | 95.8 /100 | #115 | Exceptional 40.7% |
| Immigrants | Uganda | 95.7 /100 | #116 | Exceptional 40.7% |
| Austrians | 95.5 /100 | #117 | Exceptional 40.6% |
| Croatians | 95.5 /100 | #118 | Exceptional 40.6% |
| Immigrants | Syria | 94.9 /100 | #119 | Exceptional 40.5% |
| Venezuelans | 94.7 /100 | #120 | Exceptional 40.5% |
| Moroccans | 94.6 /100 | #121 | Exceptional 40.5% |
| Immigrants | Albania | 94.4 /100 | #122 | Exceptional 40.4% |
| Lebanese | 94.3 /100 | #123 | Exceptional 40.4% |
| Immigrants | Eritrea | 94.3 /100 | #124 | Exceptional 40.4% |
| British | 94.2 /100 | #125 | Exceptional 40.4% |
| Immigrants | Eastern Africa | 94.1 /100 | #126 | Exceptional 40.4% |
| Immigrants | Jordan | 93.4 /100 | #127 | Exceptional 40.3% |
| Immigrants | Venezuela | 92.9 /100 | #128 | Exceptional 40.2% |
Demographics Similar to Paiute by Bachelor's Degree
In terms of bachelor's degree, the demographic groups most similar to Paiute are Apache (28.3%, a difference of 0.67%), Pennsylvania German (28.4%, a difference of 1.1%), Crow (27.7%, a difference of 1.2%), Dutch West Indian (28.5%, a difference of 1.5%), and Fijian (28.7%, a difference of 2.2%).
| Demographics | Rating | Rank | Bachelor's Degree |
| Kiowa | 0.0 /100 | #320 | Tragic 28.8% |
| Alaskan Athabascans | 0.0 /100 | #321 | Tragic 28.8% |
| Tsimshian | 0.0 /100 | #322 | Tragic 28.8% |
| Fijians | 0.0 /100 | #323 | Tragic 28.7% |
| Dutch West Indians | 0.0 /100 | #324 | Tragic 28.5% |
| Pennsylvania Germans | 0.0 /100 | #325 | Tragic 28.4% |
| Apache | 0.0 /100 | #326 | Tragic 28.3% |
| Paiute | 0.0 /100 | #327 | Tragic 28.1% |
| Crow | 0.0 /100 | #328 | Tragic 27.7% |
| Immigrants | Central America | 0.0 /100 | #329 | Tragic 27.5% |
| Spanish American Indians | 0.0 /100 | #330 | Tragic 27.5% |
| Immigrants | Azores | 0.0 /100 | #331 | Tragic 27.3% |
| Menominee | 0.0 /100 | #332 | Tragic 27.3% |
| Mexicans | 0.0 /100 | #333 | Tragic 27.1% |
| Arapaho | 0.0 /100 | #334 | Tragic 26.6% |