Moroccan vs Immigrants from South Central Asia 6th Grade
COMPARE
Moroccan
Immigrants from South Central Asia
6th Grade
6th Grade Comparison
Moroccans
Immigrants from South Central Asia
96.8%
6TH GRADE
9.0/ 100
METRIC RATING
212th/ 347
METRIC RANK
97.2%
6TH GRADE
78.1/ 100
METRIC RATING
147th/ 347
METRIC RANK
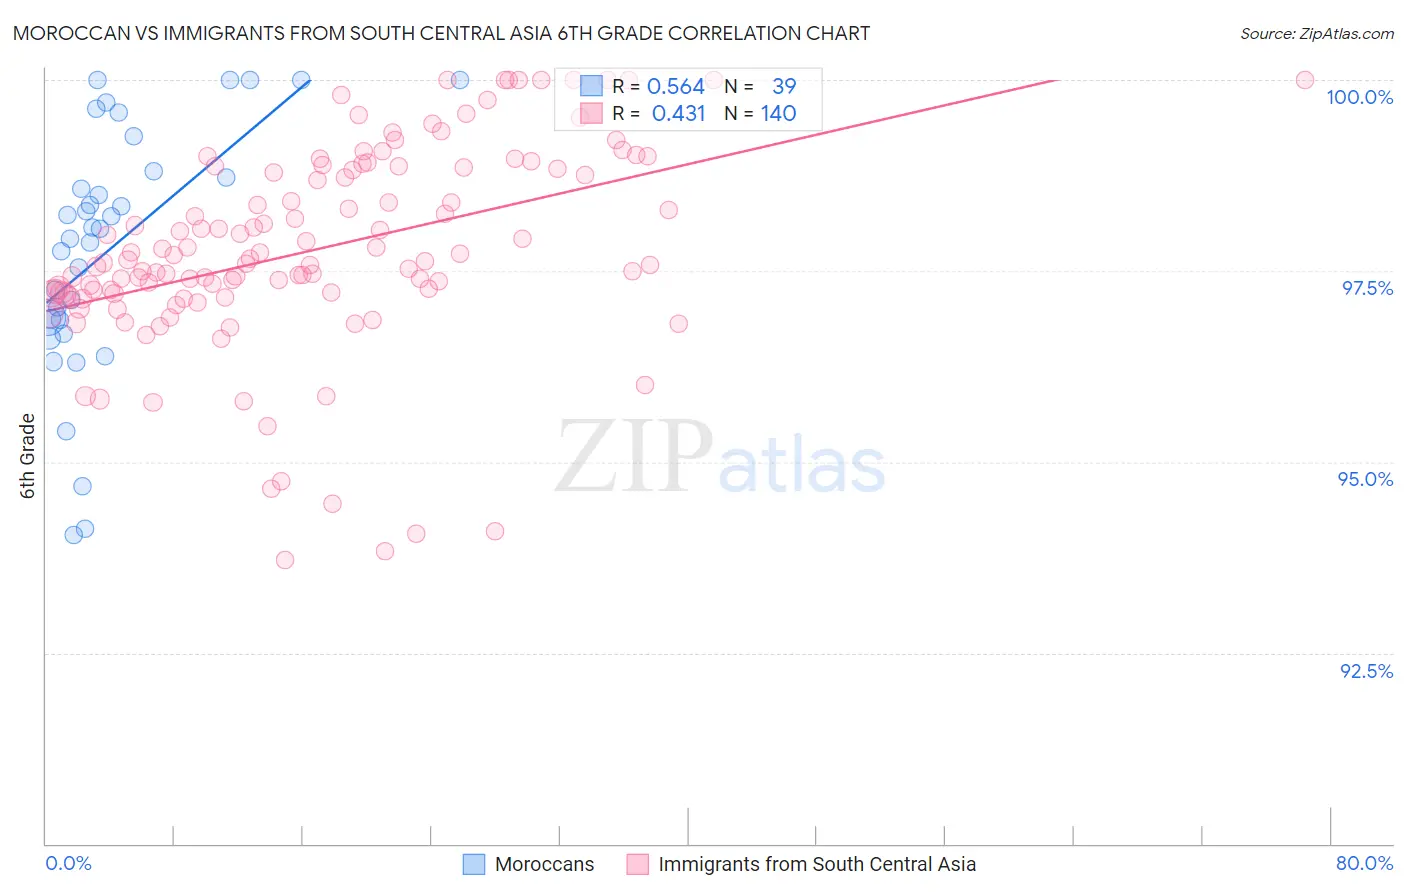
Moroccan vs Immigrants from South Central Asia 6th Grade Correlation Chart
The statistical analysis conducted on geographies consisting of 201,817,667 people shows a substantial positive correlation between the proportion of Moroccans and percentage of population with at least 6th grade education in the United States with a correlation coefficient (R) of 0.564 and weighted average of 96.8%. Similarly, the statistical analysis conducted on geographies consisting of 473,113,181 people shows a moderate positive correlation between the proportion of Immigrants from South Central Asia and percentage of population with at least 6th grade education in the United States with a correlation coefficient (R) of 0.431 and weighted average of 97.2%, a difference of 0.41%.
6th Grade Correlation Summary
| Measurement | Moroccan | Immigrants from South Central Asia |
| Minimum | 94.0% | 93.7% |
| Maximum | 100.0% | 100.0% |
| Range | 6.0% | 6.3% |
| Mean | 97.8% | 97.8% |
| Median | 98.1% | 97.6% |
| Interquartile 25% (IQ1) | 96.9% | 97.2% |
| Interquartile 75% (IQ3) | 98.8% | 98.8% |
| Interquartile Range (IQR) | 1.9% | 1.6% |
| Standard Deviation (Sample) | 1.6% | 1.3% |
| Standard Deviation (Population) | 1.6% | 1.3% |
Similar Demographics by 6th Grade
Demographics Similar to Moroccans by 6th Grade
In terms of 6th grade, the demographic groups most similar to Moroccans are Immigrants from Iraq (96.8%, a difference of 0.0%), Immigrants from Sudan (96.8%, a difference of 0.0%), Portuguese (96.8%, a difference of 0.010%), Sierra Leonean (96.8%, a difference of 0.010%), and Immigrants from Nepal (96.8%, a difference of 0.020%).
| Demographics | Rating | Rank | 6th Grade |
| Natives/Alaskans | 13.0 /100 | #205 | Poor 96.8% |
| Laotians | 11.8 /100 | #206 | Poor 96.8% |
| Iraqis | 11.7 /100 | #207 | Poor 96.8% |
| Samoans | 11.0 /100 | #208 | Poor 96.8% |
| Immigrants | Oceania | 11.0 /100 | #209 | Poor 96.8% |
| Immigrants | Nepal | 10.1 /100 | #210 | Poor 96.8% |
| Immigrants | Iraq | 9.2 /100 | #211 | Tragic 96.8% |
| Moroccans | 9.0 /100 | #212 | Tragic 96.8% |
| Immigrants | Sudan | 8.7 /100 | #213 | Tragic 96.8% |
| Portuguese | 8.2 /100 | #214 | Tragic 96.8% |
| Sierra Leoneans | 8.0 /100 | #215 | Tragic 96.8% |
| Paiute | 7.8 /100 | #216 | Tragic 96.8% |
| Liberians | 7.5 /100 | #217 | Tragic 96.8% |
| Navajo | 7.3 /100 | #218 | Tragic 96.8% |
| Costa Ricans | 6.8 /100 | #219 | Tragic 96.8% |
Demographics Similar to Immigrants from South Central Asia by 6th Grade
In terms of 6th grade, the demographic groups most similar to Immigrants from South Central Asia are Immigrants from Greece (97.2%, a difference of 0.0%), Spaniard (97.2%, a difference of 0.010%), Hopi (97.2%, a difference of 0.010%), Immigrants from Israel (97.2%, a difference of 0.010%), and Immigrants from Bosnia and Herzegovina (97.2%, a difference of 0.020%).
| Demographics | Rating | Rank | 6th Grade |
| Immigrants | North Macedonia | 85.5 /100 | #140 | Excellent 97.2% |
| Seminole | 84.8 /100 | #141 | Excellent 97.2% |
| Jordanians | 84.6 /100 | #142 | Excellent 97.2% |
| Pima | 82.9 /100 | #143 | Excellent 97.2% |
| Israelis | 82.9 /100 | #144 | Excellent 97.2% |
| Spaniards | 80.1 /100 | #145 | Excellent 97.2% |
| Hopi | 78.8 /100 | #146 | Good 97.2% |
| Immigrants | South Central Asia | 78.1 /100 | #147 | Good 97.2% |
| Immigrants | Greece | 77.8 /100 | #148 | Good 97.2% |
| Immigrants | Israel | 76.0 /100 | #149 | Good 97.2% |
| Immigrants | Bosnia and Herzegovina | 74.8 /100 | #150 | Good 97.2% |
| French American Indians | 74.0 /100 | #151 | Good 97.2% |
| Immigrants | Jordan | 73.0 /100 | #152 | Good 97.2% |
| Immigrants | Eastern Europe | 72.6 /100 | #153 | Good 97.2% |
| Soviet Union | 71.5 /100 | #154 | Good 97.2% |