Moroccan vs Immigrants from Portugal 11th Grade
COMPARE
Moroccan
Immigrants from Portugal
11th Grade
11th Grade Comparison
Moroccans
Immigrants from Portugal
92.3%
11TH GRADE
28.7/ 100
METRIC RATING
193rd/ 347
METRIC RANK
89.3%
11TH GRADE
0.0/ 100
METRIC RATING
312th/ 347
METRIC RANK
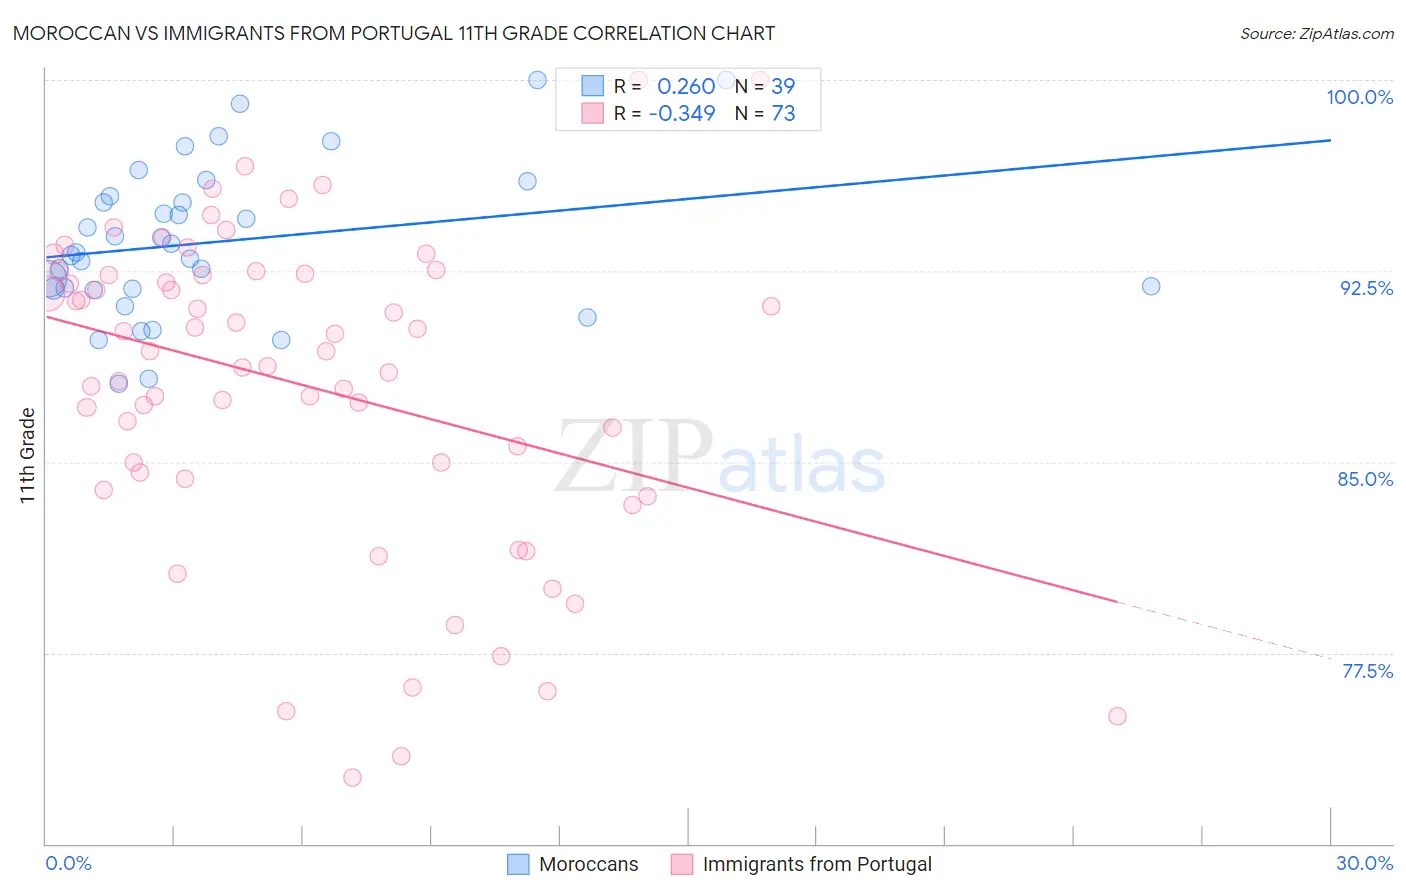
Moroccan vs Immigrants from Portugal 11th Grade Correlation Chart
The statistical analysis conducted on geographies consisting of 201,817,667 people shows a weak positive correlation between the proportion of Moroccans and percentage of population with at least 11th grade education in the United States with a correlation coefficient (R) of 0.260 and weighted average of 92.3%. Similarly, the statistical analysis conducted on geographies consisting of 174,792,107 people shows a mild negative correlation between the proportion of Immigrants from Portugal and percentage of population with at least 11th grade education in the United States with a correlation coefficient (R) of -0.349 and weighted average of 89.3%, a difference of 3.4%.
11th Grade Correlation Summary
| Measurement | Moroccan | Immigrants from Portugal |
| Minimum | 88.1% | 72.6% |
| Maximum | 100.0% | 100.0% |
| Range | 11.9% | 27.4% |
| Mean | 93.6% | 88.0% |
| Median | 93.2% | 89.3% |
| Interquartile 25% (IQ1) | 91.8% | 84.4% |
| Interquartile 75% (IQ3) | 95.4% | 92.4% |
| Interquartile Range (IQR) | 3.6% | 7.9% |
| Standard Deviation (Sample) | 3.0% | 6.2% |
| Standard Deviation (Population) | 3.0% | 6.2% |
Similar Demographics by 11th Grade
Demographics Similar to Moroccans by 11th Grade
In terms of 11th grade, the demographic groups most similar to Moroccans are Sioux (92.3%, a difference of 0.0%), French American Indian (92.3%, a difference of 0.020%), Immigrants from Syria (92.3%, a difference of 0.020%), Liberian (92.3%, a difference of 0.020%), and Chickasaw (92.3%, a difference of 0.030%).
| Demographics | Rating | Rank | 11th Grade |
| Arapaho | 35.1 /100 | #186 | Fair 92.4% |
| Immigrants | Western Asia | 35.0 /100 | #187 | Fair 92.4% |
| Immigrants | Indonesia | 33.7 /100 | #188 | Fair 92.4% |
| Immigrants | Chile | 33.3 /100 | #189 | Fair 92.4% |
| Chickasaw | 31.4 /100 | #190 | Fair 92.3% |
| French American Indians | 30.8 /100 | #191 | Fair 92.3% |
| Immigrants | Syria | 30.4 /100 | #192 | Fair 92.3% |
| Moroccans | 28.7 /100 | #193 | Fair 92.3% |
| Sioux | 28.5 /100 | #194 | Fair 92.3% |
| Liberians | 26.8 /100 | #195 | Fair 92.3% |
| Panamanians | 26.4 /100 | #196 | Fair 92.3% |
| Marshallese | 26.0 /100 | #197 | Fair 92.3% |
| Hawaiians | 25.5 /100 | #198 | Fair 92.3% |
| Immigrants | Uganda | 25.2 /100 | #199 | Fair 92.3% |
| Samoans | 25.1 /100 | #200 | Fair 92.3% |
Demographics Similar to Immigrants from Portugal by 11th Grade
In terms of 11th grade, the demographic groups most similar to Immigrants from Portugal are Vietnamese (89.4%, a difference of 0.18%), Immigrants from Caribbean (89.1%, a difference of 0.20%), Cape Verdean (89.1%, a difference of 0.22%), Immigrants from Ecuador (89.1%, a difference of 0.23%), and Yaqui (89.5%, a difference of 0.24%).
| Demographics | Rating | Rank | 11th Grade |
| Immigrants | Cambodia | 0.0 /100 | #305 | Tragic 89.6% |
| Ecuadorians | 0.0 /100 | #306 | Tragic 89.6% |
| Immigrants | Dominica | 0.0 /100 | #307 | Tragic 89.5% |
| Nepalese | 0.0 /100 | #308 | Tragic 89.5% |
| Immigrants | Bangladesh | 0.0 /100 | #309 | Tragic 89.5% |
| Yaqui | 0.0 /100 | #310 | Tragic 89.5% |
| Vietnamese | 0.0 /100 | #311 | Tragic 89.4% |
| Immigrants | Portugal | 0.0 /100 | #312 | Tragic 89.3% |
| Immigrants | Caribbean | 0.0 /100 | #313 | Tragic 89.1% |
| Cape Verdeans | 0.0 /100 | #314 | Tragic 89.1% |
| Immigrants | Ecuador | 0.0 /100 | #315 | Tragic 89.1% |
| Immigrants | Cuba | 0.0 /100 | #316 | Tragic 88.9% |
| Lumbee | 0.0 /100 | #317 | Tragic 88.9% |
| Nicaraguans | 0.0 /100 | #318 | Tragic 88.9% |
| Belizeans | 0.0 /100 | #319 | Tragic 88.8% |