Mongolian vs Estonian 2nd Grade
COMPARE
Mongolian
Estonian
2nd Grade
2nd Grade Comparison
Mongolians
Estonians
97.8%
2ND GRADE
26.7/ 100
METRIC RATING
195th/ 347
METRIC RANK
98.4%
2ND GRADE
99.8/ 100
METRIC RATING
51st/ 347
METRIC RANK
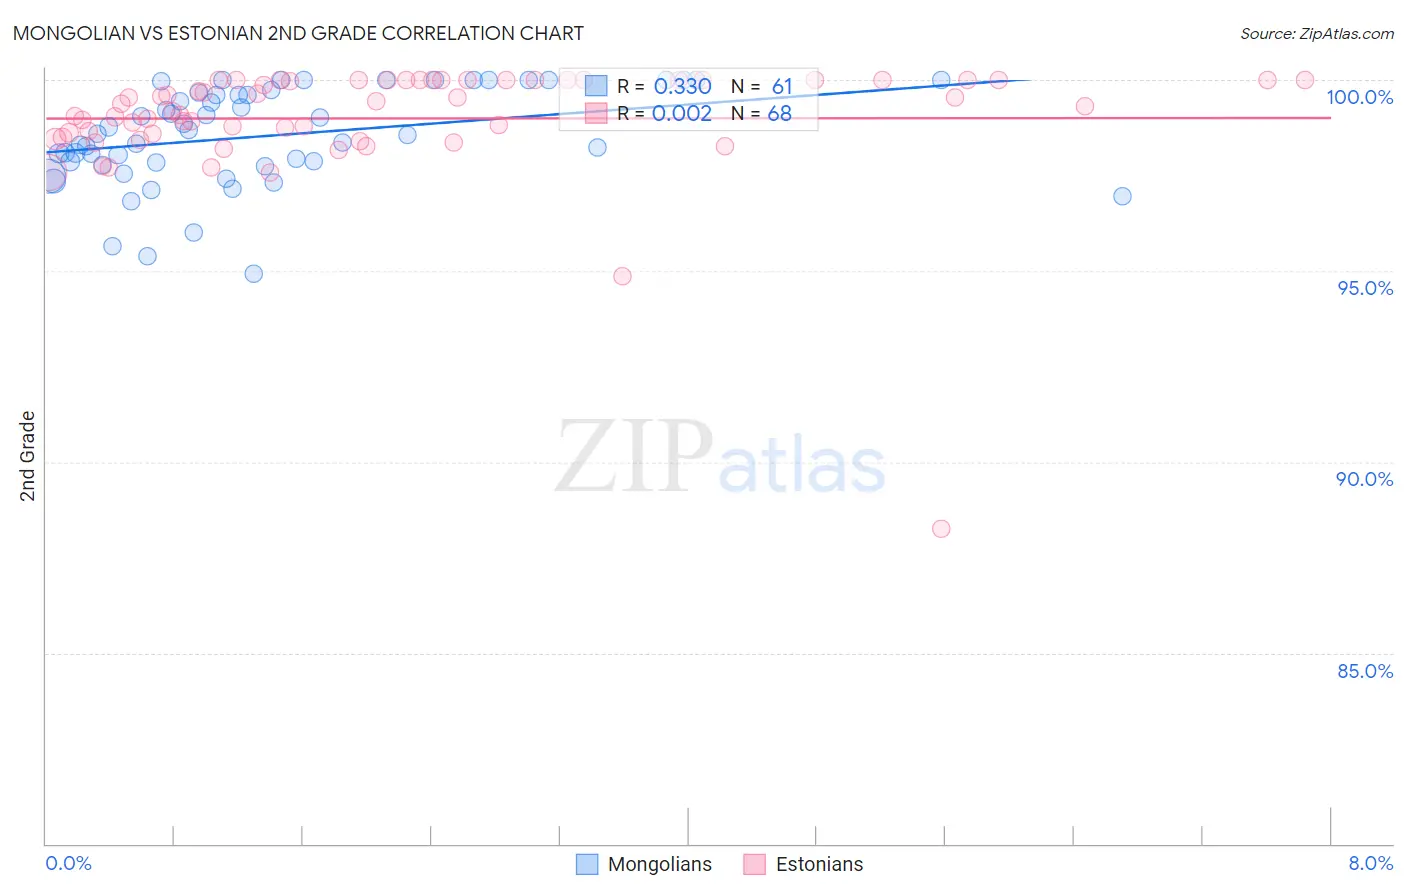
Mongolian vs Estonian 2nd Grade Correlation Chart
The statistical analysis conducted on geographies consisting of 140,362,004 people shows a mild positive correlation between the proportion of Mongolians and percentage of population with at least 2nd grade education in the United States with a correlation coefficient (R) of 0.330 and weighted average of 97.8%. Similarly, the statistical analysis conducted on geographies consisting of 123,528,404 people shows no correlation between the proportion of Estonians and percentage of population with at least 2nd grade education in the United States with a correlation coefficient (R) of 0.002 and weighted average of 98.4%, a difference of 0.58%.
2nd Grade Correlation Summary
| Measurement | Mongolian | Estonian |
| Minimum | 94.9% | 88.3% |
| Maximum | 100.0% | 100.0% |
| Range | 5.1% | 11.7% |
| Mean | 98.5% | 99.0% |
| Median | 98.6% | 99.3% |
| Interquartile 25% (IQ1) | 97.8% | 98.5% |
| Interquartile 75% (IQ3) | 99.7% | 100.0% |
| Interquartile Range (IQR) | 1.9% | 1.5% |
| Standard Deviation (Sample) | 1.3% | 1.6% |
| Standard Deviation (Population) | 1.3% | 1.6% |
Similar Demographics by 2nd Grade
Demographics Similar to Mongolians by 2nd Grade
In terms of 2nd grade, the demographic groups most similar to Mongolians are Paiute (97.8%, a difference of 0.0%), Immigrants from Kenya (97.8%, a difference of 0.0%), Immigrants from Uganda (97.8%, a difference of 0.0%), Guamanian/Chamorro (97.8%, a difference of 0.0%), and Black/African American (97.8%, a difference of 0.010%).
| Demographics | Rating | Rank | 2nd Grade |
| Immigrants | Kazakhstan | 35.6 /100 | #188 | Fair 97.8% |
| Panamanians | 33.5 /100 | #189 | Fair 97.8% |
| Immigrants | Taiwan | 31.8 /100 | #190 | Fair 97.8% |
| Paraguayans | 30.8 /100 | #191 | Fair 97.8% |
| Blacks/African Americans | 29.9 /100 | #192 | Fair 97.8% |
| Hawaiians | 28.5 /100 | #193 | Fair 97.8% |
| Paiute | 27.0 /100 | #194 | Fair 97.8% |
| Mongolians | 26.7 /100 | #195 | Fair 97.8% |
| Immigrants | Kenya | 26.4 /100 | #196 | Fair 97.8% |
| Immigrants | Uganda | 26.3 /100 | #197 | Fair 97.8% |
| Guamanians/Chamorros | 25.7 /100 | #198 | Fair 97.8% |
| Immigrants | Egypt | 24.4 /100 | #199 | Fair 97.8% |
| Immigrants | Lebanon | 20.9 /100 | #200 | Fair 97.8% |
| Tohono O'odham | 20.9 /100 | #201 | Fair 97.8% |
| Immigrants | Ukraine | 20.5 /100 | #202 | Fair 97.8% |
Demographics Similar to Estonians by 2nd Grade
In terms of 2nd grade, the demographic groups most similar to Estonians are Celtic (98.4%, a difference of 0.0%), White/Caucasian (98.4%, a difference of 0.0%), Australian (98.4%, a difference of 0.0%), Czechoslovakian (98.4%, a difference of 0.010%), and Pueblo (98.3%, a difference of 0.010%).
| Demographics | Rating | Rank | 2nd Grade |
| Northern Europeans | 99.9 /100 | #44 | Exceptional 98.4% |
| Hungarians | 99.9 /100 | #45 | Exceptional 98.4% |
| Lumbee | 99.9 /100 | #46 | Exceptional 98.4% |
| Ottawa | 99.9 /100 | #47 | Exceptional 98.4% |
| Czechoslovakians | 99.9 /100 | #48 | Exceptional 98.4% |
| Celtics | 99.8 /100 | #49 | Exceptional 98.4% |
| Whites/Caucasians | 99.8 /100 | #50 | Exceptional 98.4% |
| Estonians | 99.8 /100 | #51 | Exceptional 98.4% |
| Australians | 99.8 /100 | #52 | Exceptional 98.4% |
| Pueblo | 99.8 /100 | #53 | Exceptional 98.3% |
| Kiowa | 99.8 /100 | #54 | Exceptional 98.3% |
| Immigrants | Scotland | 99.8 /100 | #55 | Exceptional 98.3% |
| Americans | 99.8 /100 | #56 | Exceptional 98.3% |
| Austrians | 99.8 /100 | #57 | Exceptional 98.3% |
| Bulgarians | 99.8 /100 | #58 | Exceptional 98.3% |