Mongolian vs Alaska Native 7th Grade
COMPARE
Mongolian
Alaska Native
7th Grade
7th Grade Comparison
Mongolians
Alaska Natives
96.0%
7TH GRADE
50.0/ 100
METRIC RATING
174th/ 347
METRIC RANK
97.3%
7TH GRADE
100.0/ 100
METRIC RATING
34th/ 347
METRIC RANK
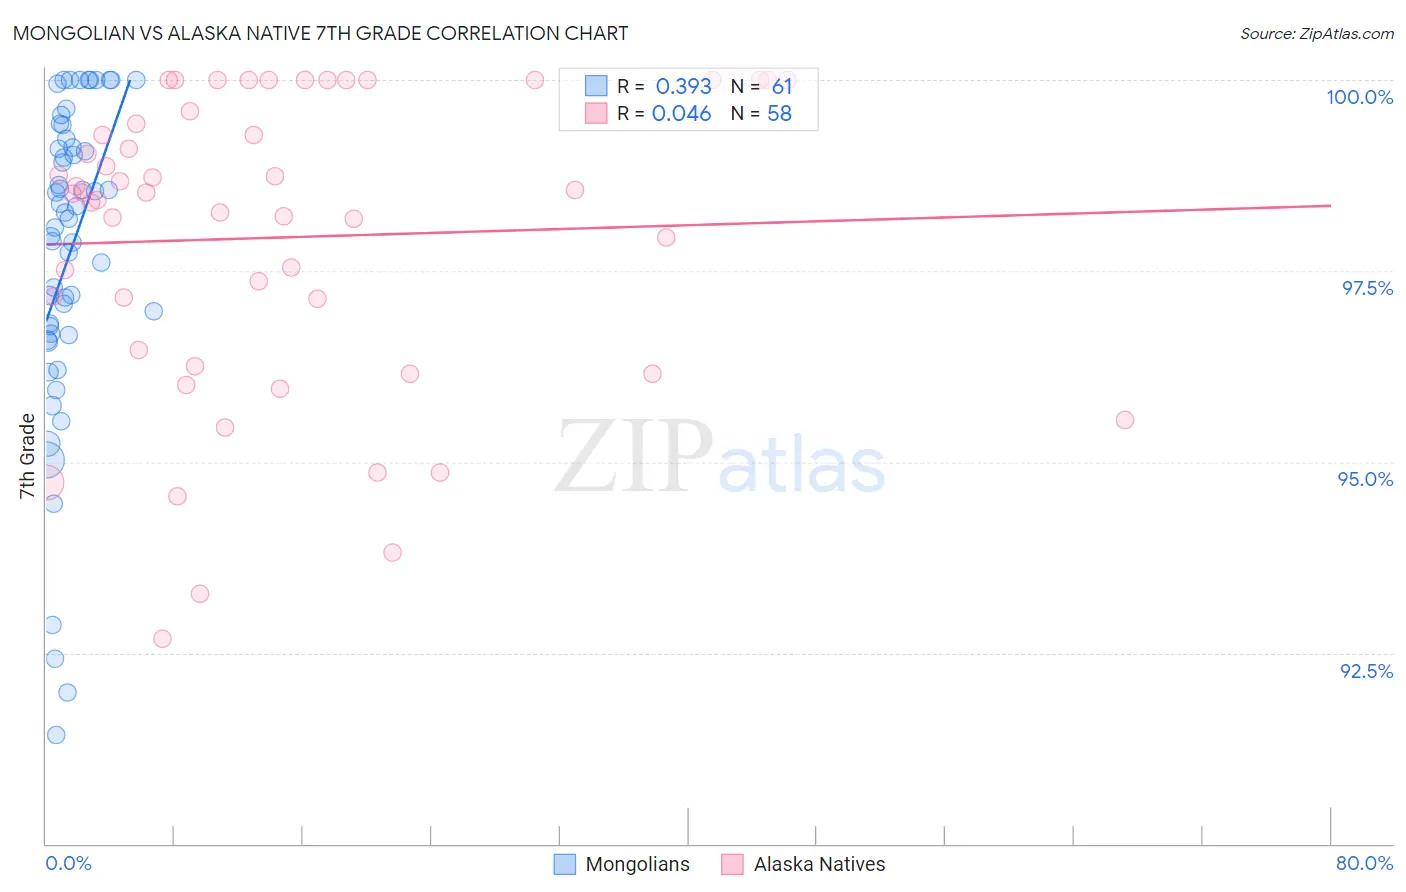
Mongolian vs Alaska Native 7th Grade Correlation Chart
The statistical analysis conducted on geographies consisting of 140,362,004 people shows a mild positive correlation between the proportion of Mongolians and percentage of population with at least 7th grade education in the United States with a correlation coefficient (R) of 0.393 and weighted average of 96.0%. Similarly, the statistical analysis conducted on geographies consisting of 76,778,057 people shows no correlation between the proportion of Alaska Natives and percentage of population with at least 7th grade education in the United States with a correlation coefficient (R) of 0.046 and weighted average of 97.3%, a difference of 1.3%.
7th Grade Correlation Summary
| Measurement | Mongolian | Alaska Native |
| Minimum | 91.4% | 92.7% |
| Maximum | 100.0% | 100.0% |
| Range | 8.6% | 7.3% |
| Mean | 97.7% | 97.9% |
| Median | 98.2% | 98.5% |
| Interquartile 25% (IQ1) | 96.7% | 96.5% |
| Interquartile 75% (IQ3) | 99.2% | 99.6% |
| Interquartile Range (IQR) | 2.5% | 3.1% |
| Standard Deviation (Sample) | 2.1% | 2.0% |
| Standard Deviation (Population) | 2.0% | 1.9% |
Similar Demographics by 7th Grade
Demographics Similar to Mongolians by 7th Grade
In terms of 7th grade, the demographic groups most similar to Mongolians are Immigrants from Albania (96.0%, a difference of 0.0%), Black/African American (96.0%, a difference of 0.0%), Chilean (96.0%, a difference of 0.0%), Venezuelan (96.0%, a difference of 0.010%), and Immigrants from Korea (96.0%, a difference of 0.010%).
| Demographics | Rating | Rank | 7th Grade |
| Immigrants | Sri Lanka | 59.9 /100 | #167 | Average 96.1% |
| Immigrants | Poland | 59.0 /100 | #168 | Average 96.1% |
| Ute | 55.8 /100 | #169 | Average 96.1% |
| Immigrants | Ukraine | 55.0 /100 | #170 | Average 96.1% |
| Egyptians | 54.2 /100 | #171 | Average 96.1% |
| Venezuelans | 51.4 /100 | #172 | Average 96.0% |
| Immigrants | Albania | 50.4 /100 | #173 | Average 96.0% |
| Mongolians | 50.0 /100 | #174 | Average 96.0% |
| Blacks/African Americans | 49.5 /100 | #175 | Average 96.0% |
| Chileans | 49.3 /100 | #176 | Average 96.0% |
| Immigrants | Korea | 49.2 /100 | #177 | Average 96.0% |
| Marshallese | 48.4 /100 | #178 | Average 96.0% |
| Immigrants | Iran | 47.8 /100 | #179 | Average 96.0% |
| Immigrants | Brazil | 46.8 /100 | #180 | Average 96.0% |
| Pakistanis | 44.5 /100 | #181 | Average 96.0% |
Demographics Similar to Alaska Natives by 7th Grade
In terms of 7th grade, the demographic groups most similar to Alaska Natives are Chippewa (97.3%, a difference of 0.030%), Swiss (97.3%, a difference of 0.030%), European (97.3%, a difference of 0.040%), Italian (97.3%, a difference of 0.040%), and Czech (97.4%, a difference of 0.060%).
| Demographics | Rating | Rank | 7th Grade |
| Danes | 100.0 /100 | #27 | Exceptional 97.4% |
| Sioux | 100.0 /100 | #28 | Exceptional 97.4% |
| Scandinavians | 100.0 /100 | #29 | Exceptional 97.4% |
| Czechs | 100.0 /100 | #30 | Exceptional 97.4% |
| Europeans | 100.0 /100 | #31 | Exceptional 97.3% |
| Italians | 100.0 /100 | #32 | Exceptional 97.3% |
| Chippewa | 100.0 /100 | #33 | Exceptional 97.3% |
| Alaska Natives | 100.0 /100 | #34 | Exceptional 97.3% |
| Swiss | 100.0 /100 | #35 | Exceptional 97.3% |
| Hungarians | 100.0 /100 | #36 | Exceptional 97.2% |
| British | 100.0 /100 | #37 | Exceptional 97.2% |
| Belgians | 100.0 /100 | #38 | Exceptional 97.2% |
| Latvians | 100.0 /100 | #39 | Exceptional 97.2% |
| Luxembourgers | 100.0 /100 | #40 | Exceptional 97.2% |
| Eastern Europeans | 100.0 /100 | #41 | Exceptional 97.2% |