Mexican vs Immigrants from Sri Lanka 10th Grade
COMPARE
Mexican
Immigrants from Sri Lanka
10th Grade
10th Grade Comparison
Mexicans
Immigrants from Sri Lanka
87.8%
10TH GRADE
0.0/ 100
METRIC RATING
340th/ 347
METRIC RANK
94.2%
10TH GRADE
89.9/ 100
METRIC RATING
138th/ 347
METRIC RANK
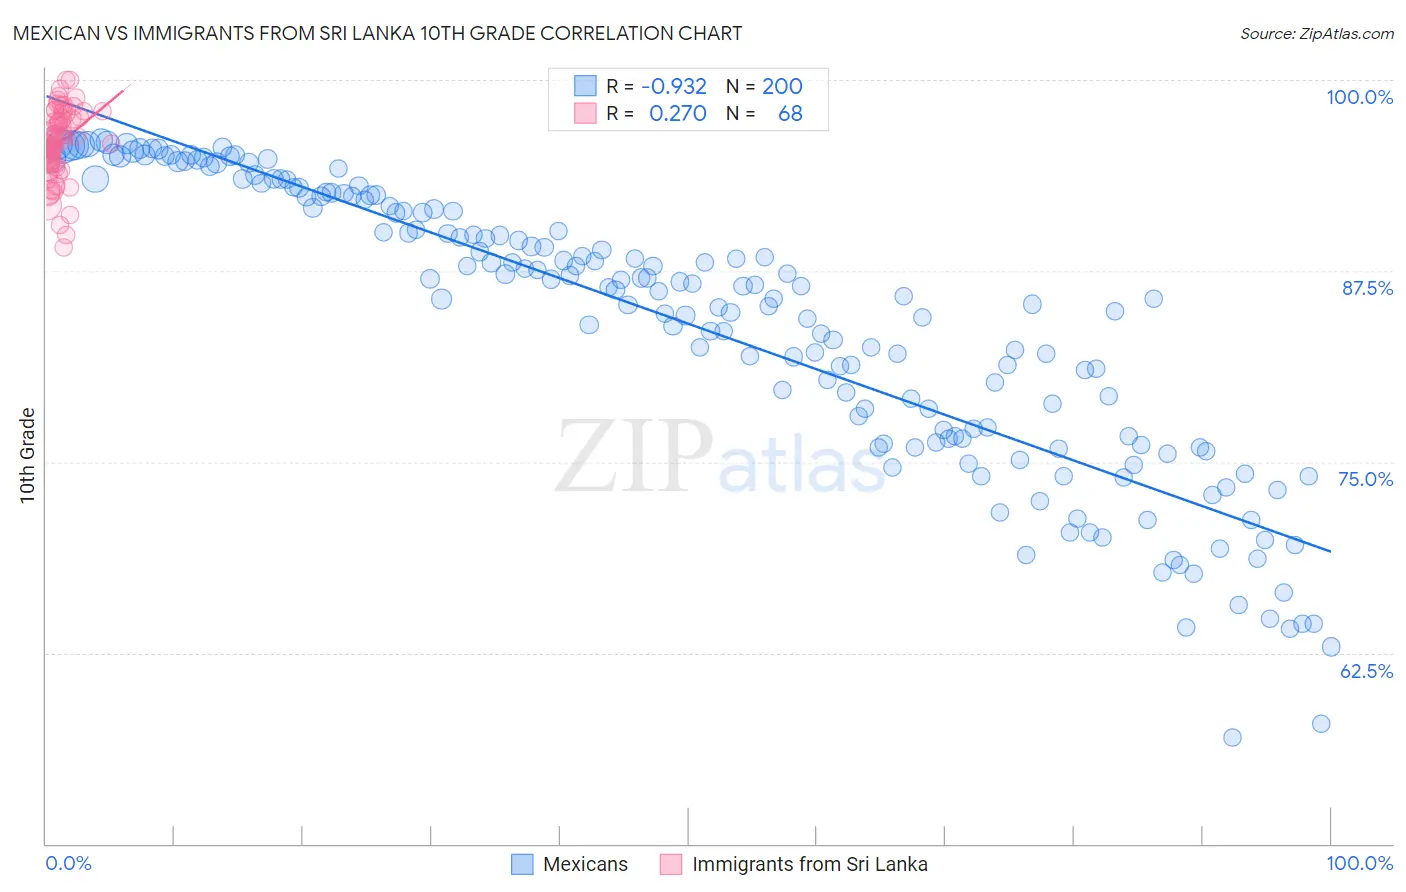
Mexican vs Immigrants from Sri Lanka 10th Grade Correlation Chart
The statistical analysis conducted on geographies consisting of 565,338,990 people shows a near-perfect negative correlation between the proportion of Mexicans and percentage of population with at least 10th grade education in the United States with a correlation coefficient (R) of -0.932 and weighted average of 87.8%. Similarly, the statistical analysis conducted on geographies consisting of 149,660,761 people shows a weak positive correlation between the proportion of Immigrants from Sri Lanka and percentage of population with at least 10th grade education in the United States with a correlation coefficient (R) of 0.270 and weighted average of 94.2%, a difference of 7.3%.
10th Grade Correlation Summary
| Measurement | Mexican | Immigrants from Sri Lanka |
| Minimum | 57.0% | 89.0% |
| Maximum | 96.1% | 100.0% |
| Range | 39.1% | 11.0% |
| Mean | 84.0% | 95.8% |
| Median | 86.3% | 96.2% |
| Interquartile 25% (IQ1) | 76.6% | 94.5% |
| Interquartile 75% (IQ3) | 92.3% | 97.7% |
| Interquartile Range (IQR) | 15.7% | 3.2% |
| Standard Deviation (Sample) | 9.3% | 2.4% |
| Standard Deviation (Population) | 9.2% | 2.4% |
Similar Demographics by 10th Grade
Demographics Similar to Mexicans by 10th Grade
In terms of 10th grade, the demographic groups most similar to Mexicans are Guatemalan (87.9%, a difference of 0.16%), Salvadoran (87.5%, a difference of 0.29%), Immigrants from Guatemala (87.4%, a difference of 0.44%), Immigrants from Latin America (88.3%, a difference of 0.65%), and Central American (88.4%, a difference of 0.71%).
| Demographics | Rating | Rank | 10th Grade |
| Hondurans | 0.0 /100 | #333 | Tragic 89.0% |
| Hispanics or Latinos | 0.0 /100 | #334 | Tragic 88.9% |
| Immigrants | Dominican Republic | 0.0 /100 | #335 | Tragic 88.7% |
| Immigrants | Honduras | 0.0 /100 | #336 | Tragic 88.5% |
| Central Americans | 0.0 /100 | #337 | Tragic 88.4% |
| Immigrants | Latin America | 0.0 /100 | #338 | Tragic 88.3% |
| Guatemalans | 0.0 /100 | #339 | Tragic 87.9% |
| Mexicans | 0.0 /100 | #340 | Tragic 87.8% |
| Salvadorans | 0.0 /100 | #341 | Tragic 87.5% |
| Immigrants | Guatemala | 0.0 /100 | #342 | Tragic 87.4% |
| Yakama | 0.0 /100 | #343 | Tragic 86.9% |
| Immigrants | El Salvador | 0.0 /100 | #344 | Tragic 86.8% |
| Immigrants | Central America | 0.0 /100 | #345 | Tragic 86.6% |
| Spanish American Indians | 0.0 /100 | #346 | Tragic 86.2% |
| Immigrants | Mexico | 0.0 /100 | #347 | Tragic 86.2% |
Demographics Similar to Immigrants from Sri Lanka by 10th Grade
In terms of 10th grade, the demographic groups most similar to Immigrants from Sri Lanka are Arapaho (94.2%, a difference of 0.010%), Immigrants from Bosnia and Herzegovina (94.2%, a difference of 0.010%), Shoshone (94.2%, a difference of 0.020%), Immigrants from Korea (94.2%, a difference of 0.040%), and Creek (94.2%, a difference of 0.050%).
| Demographics | Rating | Rank | 10th Grade |
| Immigrants | Eastern Europe | 92.5 /100 | #131 | Exceptional 94.3% |
| Immigrants | Russia | 92.4 /100 | #132 | Exceptional 94.3% |
| Creek | 91.9 /100 | #133 | Exceptional 94.2% |
| Osage | 91.7 /100 | #134 | Exceptional 94.2% |
| Immigrants | Korea | 91.3 /100 | #135 | Exceptional 94.2% |
| Shoshone | 90.8 /100 | #136 | Exceptional 94.2% |
| Arapaho | 90.5 /100 | #137 | Exceptional 94.2% |
| Immigrants | Sri Lanka | 89.9 /100 | #138 | Excellent 94.2% |
| Immigrants | Bosnia and Herzegovina | 89.4 /100 | #139 | Excellent 94.2% |
| Immigrants | Jordan | 87.6 /100 | #140 | Excellent 94.1% |
| Hmong | 86.6 /100 | #141 | Excellent 94.1% |
| Albanians | 86.5 /100 | #142 | Excellent 94.1% |
| Cherokee | 84.9 /100 | #143 | Excellent 94.1% |
| Immigrants | Kazakhstan | 84.9 /100 | #144 | Excellent 94.1% |
| Immigrants | Nonimmigrants | 83.8 /100 | #145 | Excellent 94.1% |