Mexican American Indian vs Osage 2nd Grade

COMPARE

Mexican American Indian
Race
Ancestry
AfghanAfricanAlaska NativeAlaskan AthabascanAlbanianAleutAlsatianAmericanApacheArabArapahoArgentineanArmenianAssyrian/Chaldean/SyriacAustralianAustrianBahamianBangladeshiBarbadianBasqueBelgianBelizeanBermudanBhutaneseBlackfeetBolivianBrazilianBritishBritish West IndianBulgarianBurmeseCajunCambodianCanadianCape VerdeanCarpatho RusynCelticCentral AmericanCentral American IndianCherokeeCheyenneChickasawChileanChineseChippewaChoctawColombianColvilleComancheCosta RicanCreeCreekCroatianCrowCubanCypriotCzechCzechoslovakianDanishDelawareDominicanDutchDutch West IndianEastern EuropeanEcuadorianEgyptianEnglishEstonianEthiopianEuropeanFijianFilipinoFinnishFrenchFrench American IndianFrench CanadianGermanGerman RussianGhanaianGreekGuamanian/ChamorroGuatemalanGuyaneseHaitianHmongHonduranHopiHoumaHungarianIcelanderIndian (Asian)IndonesianInupiatIranianIraqiIrishIroquoisIsraeliItalianJamaicanJapaneseJordanianKenyanKiowaKoreanLaotianLatvianLebaneseLiberianLithuanianLumbeeLuxembourgerMacedonianMalaysianMalteseMarshalleseMenomineeMexicanMexican American IndianMongolianMoroccanNative HawaiianNavajoNepaleseNew ZealanderNicaraguanNigerianNorthern EuropeanNorwegianOkinawanOttawaPaiutePakistaniPalestinianPanamanianParaguayanPennsylvania GermanPeruvianPimaPolishPortuguesePotawatomiPuebloPuerto RicanPuget Sound SalishRomanianRussianSalvadoranSamoanScandinavianScotch-IrishScottishSeminoleSenegaleseSerbianShoshoneSierra LeoneanSiouxSlavicSlovakSloveneSomaliSouth AfricanSouth AmericanSouth American IndianSoviet UnionSpaniardSpanishSpanish AmericanSpanish American IndianSri LankanSubsaharan AfricanSudaneseSwedishSwissSyrianTaiwaneseThaiTlingit-HaidaTohono O'OdhamTonganTrinidadian and TobagonianTsimshianTurkishU.S. Virgin IslanderUgandanUkrainianUruguayanUteVenezuelanVietnameseWelshWest IndianYakamaYaquiYugoslavianYumanYup'ikZimbabwean
Immigration
NonimmigrantsImmigrantsAfghanistanAfricaAlbaniaArgentinaArmeniaAsiaAustraliaAustriaBahamasBangladeshBarbadosBelarusBelgiumBelizeBoliviaBosnia and HerzegovinaBrazilBulgariaBurma/MyanmarCabo VerdeCambodiaCameroonCanadaCaribbeanCentral AmericaChileChinaColombiaCongoCosta RicaCroatiaCubaCzechoslovakiaDenmarkDominicaDominican RepublicEastern AfricaEastern AsiaEastern EuropeEcuadorEgyptEl SalvadorEnglandEritreaEthiopiaEuropeFijiFranceGermanyGhanaGreeceGrenadaGuatemalaGuyanaHaitiHondurasHong KongHungaryIndiaIndonesiaIranIraqIrelandIsraelItalyJamaicaJapanJordanKazakhstanKenyaKoreaKuwaitLaosLatin AmericaLatviaLebanonLiberiaLithuaniaMalaysiaMexicoMicronesiaMiddle AfricaMoldovaMoroccoNepalNetherlandsNicaraguaNigeriaNorth AmericaNorth MacedoniaNorthern AfricaNorthern EuropeNorwayOceaniaPakistanPanamaPeruPhilippinesPolandPortugalRomaniaRussiaSaudi ArabiaScotlandSenegalSerbiaSierra LeoneSingaporeSomaliaSouth AfricaSouth AmericaSouth Central AsiaSouth Eastern AsiaSouthern EuropeSpainSri LankaSt. Vincent and the GrenadinesSudanSwedenSwitzerlandSyriaTaiwanThailandTrinidad and TobagoTurkeyUgandaUkraineUruguayUzbekistanVenezuelaVietnamWest IndiesWestern AfricaWestern AsiaWestern EuropeYemenZaireZimbabweAzores
Osage
Race
Ancestry
AfghanAfricanAlaska NativeAlaskan AthabascanAlbanianAleutAlsatianAmericanApacheArabArapahoArgentineanArmenianAssyrian/Chaldean/SyriacAustralianAustrianBahamianBangladeshiBarbadianBasqueBelgianBelizeanBermudanBhutaneseBlackfeetBolivianBrazilianBritishBritish West IndianBulgarianBurmeseCajunCambodianCanadianCape VerdeanCarpatho RusynCelticCentral AmericanCentral American IndianCherokeeCheyenneChickasawChileanChineseChippewaChoctawColombianColvilleComancheCosta RicanCreeCreekCroatianCrowCubanCypriotCzechCzechoslovakianDanishDelawareDominicanDutchDutch West IndianEastern EuropeanEcuadorianEgyptianEnglishEstonianEthiopianEuropeanFijianFilipinoFinnishFrenchFrench American IndianFrench CanadianGermanGerman RussianGhanaianGreekGuamanian/ChamorroGuatemalanGuyaneseHaitianHmongHonduranHopiHoumaHungarianIcelanderIndian (Asian)IndonesianInupiatIranianIraqiIrishIroquoisIsraeliItalianJamaicanJapaneseJordanianKenyanKiowaKoreanLaotianLatvianLebaneseLiberianLithuanianLumbeeLuxembourgerMacedonianMalaysianMalteseMarshalleseMenomineeMexicanMongolianMoroccanNative HawaiianNavajoNepaleseNew ZealanderNicaraguanNigerianNorthern EuropeanNorwegianOkinawanOsageOttawaPaiutePakistaniPalestinianPanamanianParaguayanPennsylvania GermanPeruvianPimaPolishPortuguesePotawatomiPuebloPuerto RicanPuget Sound SalishRomanianRussianSalvadoranSamoanScandinavianScotch-IrishScottishSeminoleSenegaleseSerbianShoshoneSierra LeoneanSiouxSlavicSlovakSloveneSomaliSouth AfricanSouth AmericanSouth American IndianSoviet UnionSpaniardSpanishSpanish AmericanSpanish American IndianSri LankanSubsaharan AfricanSudaneseSwedishSwissSyrianTaiwaneseThaiTlingit-HaidaTohono O'OdhamTonganTrinidadian and TobagonianTsimshianTurkishU.S. Virgin IslanderUgandanUkrainianUruguayanUteVenezuelanVietnameseWelshWest IndianYakamaYaquiYugoslavianYumanYup'ikZimbabwean
Immigration
NonimmigrantsImmigrantsAfghanistanAfricaAlbaniaArgentinaArmeniaAsiaAustraliaAustriaBahamasBangladeshBarbadosBelarusBelgiumBelizeBoliviaBosnia and HerzegovinaBrazilBulgariaBurma/MyanmarCabo VerdeCambodiaCameroonCanadaCaribbeanCentral AmericaChileChinaColombiaCongoCosta RicaCroatiaCubaCzechoslovakiaDenmarkDominicaDominican RepublicEastern AfricaEastern AsiaEastern EuropeEcuadorEgyptEl SalvadorEnglandEritreaEthiopiaEuropeFijiFranceGermanyGhanaGreeceGrenadaGuatemalaGuyanaHaitiHondurasHong KongHungaryIndiaIndonesiaIranIraqIrelandIsraelItalyJamaicaJapanJordanKazakhstanKenyaKoreaKuwaitLaosLatin AmericaLatviaLebanonLiberiaLithuaniaMalaysiaMexicoMicronesiaMiddle AfricaMoldovaMoroccoNepalNetherlandsNicaraguaNigeriaNorth AmericaNorth MacedoniaNorthern AfricaNorthern EuropeNorwayOceaniaPakistanPanamaPeruPhilippinesPolandPortugalRomaniaRussiaSaudi ArabiaScotlandSenegalSerbiaSierra LeoneSingaporeSomaliaSouth AfricaSouth AmericaSouth Central AsiaSouth Eastern AsiaSouthern EuropeSpainSri LankaSt. Vincent and the GrenadinesSudanSwedenSwitzerlandSyriaTaiwanThailandTrinidad and TobagoTurkeyUgandaUkraineUruguayUzbekistanVenezuelaVietnamWest IndiesWestern AfricaWestern AsiaWestern EuropeYemenZaireZimbabweAzores
2nd Grade
Income
Poverty
Unemployment
Labor Participation
Family Structure
Vehicle Availability
Education Level
Disability

2nd Grade Comparison

Mexican American Indians

Osage

Tragic
Exceptional
96.7%
2ND GRADE
0.0/ 100
METRIC RATING
324th/ 347
METRIC RANK
98.2%
2ND GRADE
99.2/ 100
METRIC RATING
80th/ 347
METRIC RANK

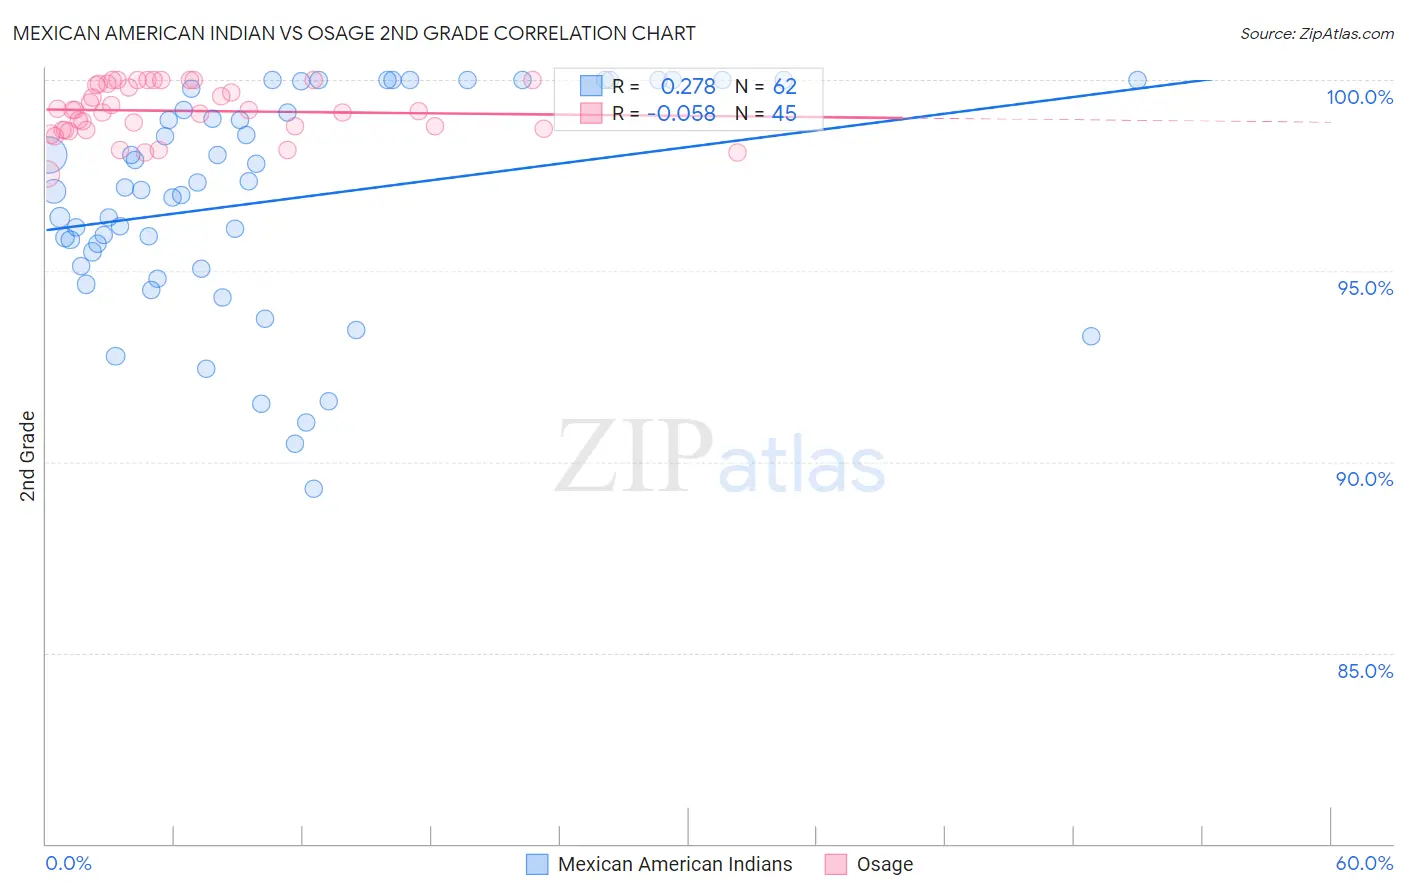
Mexican American Indian vs Osage 2nd Grade Correlation Chart

The statistical analysis conducted on geographies consisting of 317,619,717 people shows a weak positive correlation between the proportion of Mexican American Indians and percentage of population with at least 2nd grade education in the United States with a correlation coefficient (R) of 0.278 and weighted average of 96.7%. Similarly, the statistical analysis conducted on geographies consisting of 91,808,929 people shows a slight negative correlation between the proportion of Osage and percentage of population with at least 2nd grade education in the United States with a correlation coefficient (R) of -0.058 and weighted average of 98.2%, a difference of 1.6%.
Mexican American Indian vs Osage 2nd Grade

2nd Grade Correlation Summary

MeasurementMexican American IndianOsage
Minimum89.3%97.5%
Maximum100.0%100.0%
Range10.7%2.5%
Mean96.9%99.2%
Median97.2%99.2%
Interquartile 25% (IQ1)95.1%98.7%
Interquartile 75% (IQ3)99.8%99.9%
Interquartile Range (IQR)4.6%1.2%
Standard Deviation (Sample)2.8%0.67%
Standard Deviation (Population)2.8%0.66%

Similar Demographics by 2nd Grade

Demographics Similar to Mexican American Indians by 2nd Grade

In terms of 2nd grade, the demographic groups most similar to Mexican American Indians are Vietnamese (96.7%, a difference of 0.020%), Dominican (96.6%, a difference of 0.040%), Immigrants from Honduras (96.6%, a difference of 0.040%), Immigrants from Bangladesh (96.7%, a difference of 0.050%), and Immigrants from Guyana (96.7%, a difference of 0.080%).
DemographicsRating | Rank2nd Grade
Immigrants | Laos
0.0
/100
|
#317
Tragic
96.7%
Indonesians
0.0
/100
|
#318
Tragic
96.7%
Immigrants | Nicaragua
0.0
/100
|
#319
Tragic
96.7%
Immigrants | Guyana
0.0
/100
|
#320
Tragic
96.7%
Immigrants | Burma/Myanmar
0.0
/100
|
#321
Tragic
96.7%
Immigrants | Bangladesh
0.0
/100
|
#322
Tragic
96.7%
Vietnamese
0.0
/100
|
#323
Tragic
96.7%
Mexican American Indians
0.0
/100
|
#324
Tragic
96.7%
Dominicans
0.0
/100
|
#325
Tragic
96.6%
Immigrants | Honduras
0.0
/100
|
#326
Tragic
96.6%
Immigrants | Vietnam
0.0
/100
|
#327
Tragic
96.5%
Mexicans
0.0
/100
|
#328
Tragic
96.5%
Japanese
0.0
/100
|
#329
Tragic
96.5%
Immigrants | Latin America
0.0
/100
|
#330
Tragic
96.5%
Immigrants | Armenia
0.0
/100
|
#331
Tragic
96.5%

Demographics Similar to Osage by 2nd Grade

In terms of 2nd grade, the demographic groups most similar to Osage are Immigrants from Lithuania (98.2%, a difference of 0.0%), Immigrants from Belgium (98.2%, a difference of 0.0%), Shoshone (98.3%, a difference of 0.010%), Cherokee (98.3%, a difference of 0.010%), and Immigrants from England (98.3%, a difference of 0.010%).
DemographicsRating | Rank2nd Grade
Cajuns
99.5
/100
|
#73
Exceptional
98.3%
Immigrants | Netherlands
99.4
/100
|
#74
Exceptional
98.3%
Shoshone
99.4
/100
|
#75
Exceptional
98.3%
Cherokee
99.4
/100
|
#76
Exceptional
98.3%
Immigrants | England
99.4
/100
|
#77
Exceptional
98.3%
Immigrants | Lithuania
99.3
/100
|
#78
Exceptional
98.2%
Immigrants | Belgium
99.3
/100
|
#79
Exceptional
98.2%
Osage
99.2
/100
|
#80
Exceptional
98.2%
Icelanders
99.2
/100
|
#81
Exceptional
98.2%
Delaware
99.1
/100
|
#82
Exceptional
98.2%
Immigrants | Sweden
99.1
/100
|
#83
Exceptional
98.2%
Hopi
99.1
/100
|
#84
Exceptional
98.2%
Potawatomi
99.1
/100
|
#85
Exceptional
98.2%
Immigrants | Australia
99.0
/100
|
#86
Exceptional
98.2%
Immigrants | Denmark
99.0
/100
|
#87
Exceptional
98.2%