Mexican American Indian vs Menominee Associate's Degree
COMPARE
Mexican American Indian
Menominee
Associate's Degree
Associate's Degree Comparison
Mexican American Indians
Menominee
38.2%
ASSOCIATE'S DEGREE
0.0/ 100
METRIC RATING
308th/ 347
METRIC RANK
36.7%
ASSOCIATE'S DEGREE
0.0/ 100
METRIC RATING
325th/ 347
METRIC RANK
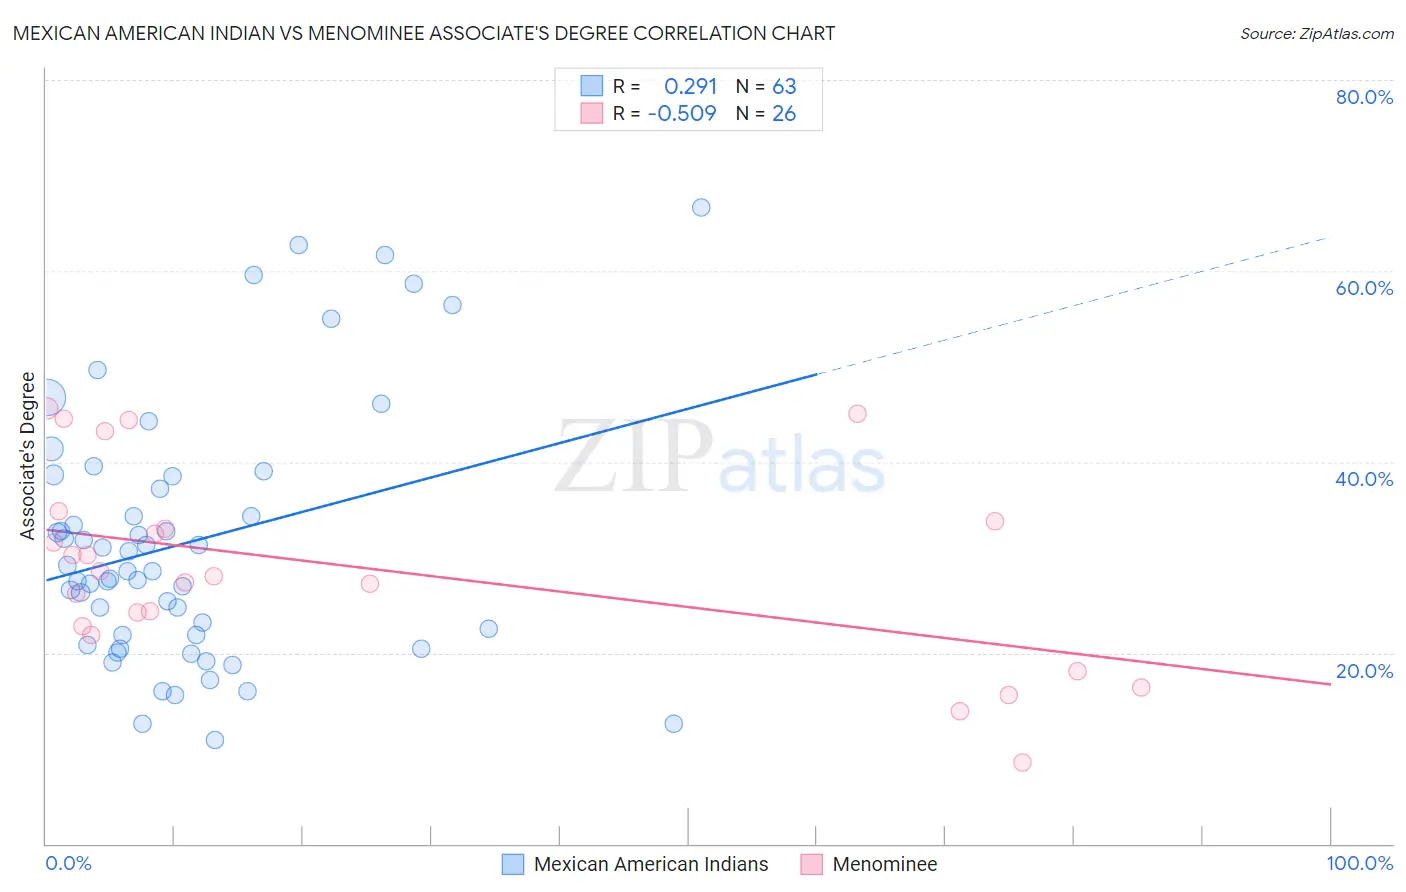
Mexican American Indian vs Menominee Associate's Degree Correlation Chart
The statistical analysis conducted on geographies consisting of 317,617,072 people shows a weak positive correlation between the proportion of Mexican American Indians and percentage of population with at least associate's degree education in the United States with a correlation coefficient (R) of 0.291 and weighted average of 38.2%. Similarly, the statistical analysis conducted on geographies consisting of 45,778,979 people shows a substantial negative correlation between the proportion of Menominee and percentage of population with at least associate's degree education in the United States with a correlation coefficient (R) of -0.509 and weighted average of 36.7%, a difference of 4.0%.
Associate's Degree Correlation Summary
| Measurement | Mexican American Indian | Menominee |
| Minimum | 10.9% | 8.5% |
| Maximum | 66.7% | 45.6% |
| Range | 55.8% | 37.1% |
| Mean | 31.6% | 28.9% |
| Median | 28.6% | 28.3% |
| Interquartile 25% (IQ1) | 21.8% | 22.8% |
| Interquartile 75% (IQ3) | 38.5% | 33.8% |
| Interquartile Range (IQR) | 16.7% | 11.0% |
| Standard Deviation (Sample) | 13.3% | 10.1% |
| Standard Deviation (Population) | 13.2% | 9.9% |
Demographics Similar to Mexican American Indians and Menominee by Associate's Degree
In terms of associate's degree, the demographic groups most similar to Mexican American Indians are Immigrants from Guatemala (38.1%, a difference of 0.040%), Immigrants from Dominican Republic (37.9%, a difference of 0.66%), Immigrants from El Salvador (38.4%, a difference of 0.67%), Shoshone (38.4%, a difference of 0.71%), and Immigrants from Latin America (37.9%, a difference of 0.77%). Similarly, the demographic groups most similar to Menominee are Arapaho (36.7%, a difference of 0.11%), Immigrants from Cabo Verde (36.8%, a difference of 0.27%), Kiowa (36.5%, a difference of 0.56%), Pennsylvania German (37.2%, a difference of 1.5%), and Immigrants from Yemen (37.3%, a difference of 1.8%).
| Demographics | Rating | Rank | Associate's Degree |
| Shoshone | 0.0 /100 | #306 | Tragic 38.4% |
| Immigrants | El Salvador | 0.0 /100 | #307 | Tragic 38.4% |
| Mexican American Indians | 0.0 /100 | #308 | Tragic 38.2% |
| Immigrants | Guatemala | 0.0 /100 | #309 | Tragic 38.1% |
| Immigrants | Dominican Republic | 0.0 /100 | #310 | Tragic 37.9% |
| Immigrants | Latin America | 0.0 /100 | #311 | Tragic 37.9% |
| Choctaw | 0.0 /100 | #312 | Tragic 37.8% |
| Hispanics or Latinos | 0.0 /100 | #313 | Tragic 37.7% |
| Seminole | 0.0 /100 | #314 | Tragic 37.7% |
| Creek | 0.0 /100 | #315 | Tragic 37.6% |
| Crow | 0.0 /100 | #316 | Tragic 37.6% |
| Yaqui | 0.0 /100 | #317 | Tragic 37.6% |
| Alaska Natives | 0.0 /100 | #318 | Tragic 37.5% |
| Fijians | 0.0 /100 | #319 | Tragic 37.4% |
| Cajuns | 0.0 /100 | #320 | Tragic 37.4% |
| Immigrants | Yemen | 0.0 /100 | #321 | Tragic 37.3% |
| Pennsylvania Germans | 0.0 /100 | #322 | Tragic 37.2% |
| Immigrants | Cabo Verde | 0.0 /100 | #323 | Tragic 36.8% |
| Arapaho | 0.0 /100 | #324 | Tragic 36.7% |
| Menominee | 0.0 /100 | #325 | Tragic 36.7% |
| Kiowa | 0.0 /100 | #326 | Tragic 36.5% |