Mexican American Indian vs Guatemalan Bachelor's Degree
COMPARE
Mexican American Indian
Guatemalan
Bachelor's Degree
Bachelor's Degree Comparison
Mexican American Indians
Guatemalans
30.2%
BACHELOR'S DEGREE
0.0/ 100
METRIC RATING
302nd/ 347
METRIC RANK
31.0%
BACHELOR'S DEGREE
0.1/ 100
METRIC RATING
288th/ 347
METRIC RANK
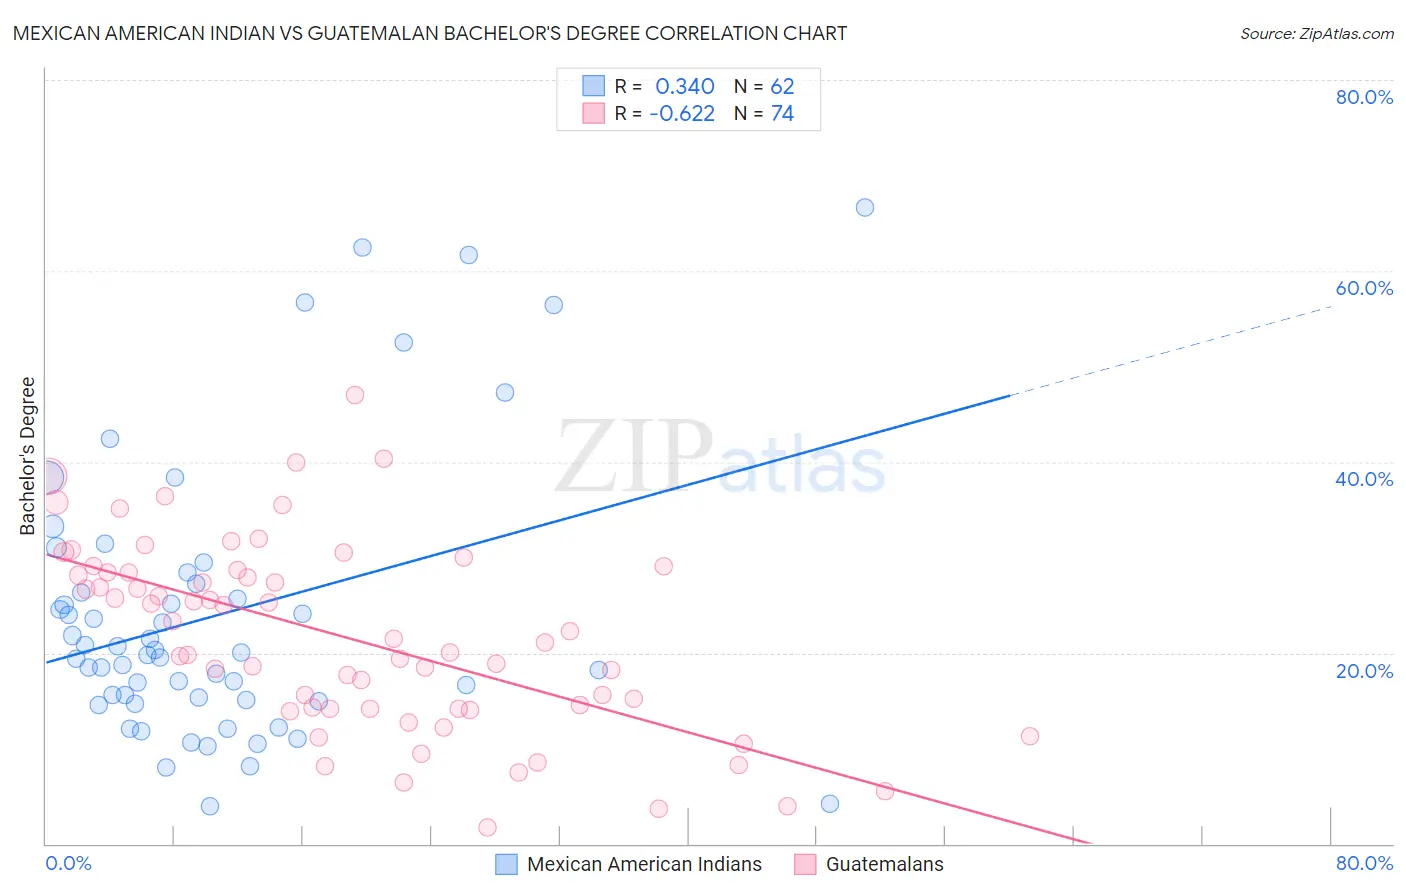
Mexican American Indian vs Guatemalan Bachelor's Degree Correlation Chart
The statistical analysis conducted on geographies consisting of 317,609,381 people shows a mild positive correlation between the proportion of Mexican American Indians and percentage of population with at least bachelor's degree education in the United States with a correlation coefficient (R) of 0.340 and weighted average of 30.2%. Similarly, the statistical analysis conducted on geographies consisting of 409,514,528 people shows a significant negative correlation between the proportion of Guatemalans and percentage of population with at least bachelor's degree education in the United States with a correlation coefficient (R) of -0.622 and weighted average of 31.0%, a difference of 2.5%.
Bachelor's Degree Correlation Summary
| Measurement | Mexican American Indian | Guatemalan |
| Minimum | 3.9% | 1.7% |
| Maximum | 66.7% | 47.0% |
| Range | 62.8% | 45.3% |
| Mean | 24.0% | 21.6% |
| Median | 19.9% | 21.3% |
| Interquartile 25% (IQ1) | 15.0% | 14.1% |
| Interquartile 75% (IQ3) | 27.2% | 28.5% |
| Interquartile Range (IQR) | 12.2% | 14.3% |
| Standard Deviation (Sample) | 14.5% | 9.9% |
| Standard Deviation (Population) | 14.4% | 9.8% |
Demographics Similar to Mexican American Indians and Guatemalans by Bachelor's Degree
In terms of bachelor's degree, the demographic groups most similar to Mexican American Indians are Bangladeshi (30.2%, a difference of 0.17%), Cherokee (30.2%, a difference of 0.17%), Immigrants from Cuba (30.3%, a difference of 0.28%), Immigrants from Micronesia (30.4%, a difference of 0.49%), and Chickasaw (30.4%, a difference of 0.51%). Similarly, the demographic groups most similar to Guatemalans are Puerto Rican (31.0%, a difference of 0.14%), Immigrants from Honduras (30.9%, a difference of 0.18%), Black/African American (30.9%, a difference of 0.22%), Ute (30.9%, a difference of 0.30%), and Ottawa (31.1%, a difference of 0.36%).
| Demographics | Rating | Rank | Bachelor's Degree |
| Aleuts | 0.1 /100 | #285 | Tragic 31.3% |
| Immigrants | El Salvador | 0.1 /100 | #286 | Tragic 31.3% |
| Ottawa | 0.1 /100 | #287 | Tragic 31.1% |
| Guatemalans | 0.1 /100 | #288 | Tragic 31.0% |
| Puerto Ricans | 0.1 /100 | #289 | Tragic 31.0% |
| Immigrants | Honduras | 0.1 /100 | #290 | Tragic 30.9% |
| Blacks/African Americans | 0.1 /100 | #291 | Tragic 30.9% |
| Ute | 0.1 /100 | #292 | Tragic 30.9% |
| Cape Verdeans | 0.1 /100 | #293 | Tragic 30.9% |
| Immigrants | Guatemala | 0.0 /100 | #294 | Tragic 30.8% |
| Immigrants | Dominican Republic | 0.0 /100 | #295 | Tragic 30.7% |
| Puget Sound Salish | 0.0 /100 | #296 | Tragic 30.7% |
| Immigrants | Haiti | 0.0 /100 | #297 | Tragic 30.6% |
| Chippewa | 0.0 /100 | #298 | Tragic 30.6% |
| Chickasaw | 0.0 /100 | #299 | Tragic 30.4% |
| Immigrants | Micronesia | 0.0 /100 | #300 | Tragic 30.4% |
| Immigrants | Cuba | 0.0 /100 | #301 | Tragic 30.3% |
| Mexican American Indians | 0.0 /100 | #302 | Tragic 30.2% |
| Bangladeshis | 0.0 /100 | #303 | Tragic 30.2% |
| Cherokee | 0.0 /100 | #304 | Tragic 30.2% |
| Immigrants | Latin America | 0.0 /100 | #305 | Tragic 30.1% |