Menominee vs Pakistani 9th Grade

COMPARE

Menominee
Race
Ancestry
AfghanAfricanAlaska NativeAlaskan AthabascanAlbanianAleutAlsatianAmericanApacheArabArapahoArgentineanArmenianAssyrian/Chaldean/SyriacAustralianAustrianBahamianBangladeshiBarbadianBasqueBelgianBelizeanBermudanBhutaneseBlackfeetBolivianBrazilianBritishBritish West IndianBulgarianBurmeseCajunCambodianCanadianCape VerdeanCarpatho RusynCelticCentral AmericanCentral American IndianCherokeeCheyenneChickasawChileanChineseChippewaChoctawColombianColvilleComancheCosta RicanCreeCreekCroatianCrowCubanCypriotCzechCzechoslovakianDanishDelawareDominicanDutchDutch West IndianEastern EuropeanEcuadorianEgyptianEnglishEstonianEthiopianEuropeanFijianFilipinoFinnishFrenchFrench American IndianFrench CanadianGermanGerman RussianGhanaianGreekGuamanian/ChamorroGuatemalanGuyaneseHaitianHmongHonduranHopiHoumaHungarianIcelanderIndian (Asian)IndonesianInupiatIranianIraqiIrishIroquoisIsraeliItalianJamaicanJapaneseJordanianKenyanKiowaKoreanLaotianLatvianLebaneseLiberianLithuanianLumbeeLuxembourgerMacedonianMalaysianMalteseMarshalleseMenomineeMexicanMexican American IndianMongolianMoroccanNative HawaiianNavajoNepaleseNew ZealanderNicaraguanNigerianNorthern EuropeanNorwegianOkinawanOsageOttawaPaiutePalestinianPanamanianParaguayanPennsylvania GermanPeruvianPimaPolishPortuguesePotawatomiPuebloPuerto RicanPuget Sound SalishRomanianRussianSalvadoranSamoanScandinavianScotch-IrishScottishSeminoleSenegaleseSerbianShoshoneSierra LeoneanSiouxSlavicSlovakSloveneSomaliSouth AfricanSouth AmericanSouth American IndianSoviet UnionSpaniardSpanishSpanish AmericanSpanish American IndianSri LankanSubsaharan AfricanSudaneseSwedishSwissSyrianTaiwaneseThaiTlingit-HaidaTohono O'OdhamTonganTrinidadian and TobagonianTsimshianTurkishU.S. Virgin IslanderUgandanUkrainianUruguayanUteVenezuelanVietnameseWelshWest IndianYakamaYaquiYugoslavianYumanYup'ikZimbabwean
Immigration
NonimmigrantsImmigrantsAfghanistanAfricaAlbaniaArgentinaArmeniaAsiaAustraliaAustriaBahamasBangladeshBarbadosBelarusBelgiumBelizeBoliviaBosnia and HerzegovinaBrazilBulgariaBurma/MyanmarCabo VerdeCambodiaCameroonCanadaCaribbeanCentral AmericaChileChinaColombiaCongoCosta RicaCroatiaCubaCzechoslovakiaDenmarkDominicaDominican RepublicEastern AfricaEastern AsiaEastern EuropeEcuadorEgyptEl SalvadorEnglandEritreaEthiopiaEuropeFijiFranceGermanyGhanaGreeceGrenadaGuatemalaGuyanaHaitiHondurasHong KongHungaryIndiaIndonesiaIranIraqIrelandIsraelItalyJamaicaJapanJordanKazakhstanKenyaKoreaKuwaitLaosLatin AmericaLatviaLebanonLiberiaLithuaniaMalaysiaMexicoMicronesiaMiddle AfricaMoldovaMoroccoNepalNetherlandsNicaraguaNigeriaNorth AmericaNorth MacedoniaNorthern AfricaNorthern EuropeNorwayOceaniaPakistanPanamaPeruPhilippinesPolandPortugalRomaniaRussiaSaudi ArabiaScotlandSenegalSerbiaSierra LeoneSingaporeSomaliaSouth AfricaSouth AmericaSouth Central AsiaSouth Eastern AsiaSouthern EuropeSpainSri LankaSt. Vincent and the GrenadinesSudanSwedenSwitzerlandSyriaTaiwanThailandTrinidad and TobagoTurkeyUgandaUkraineUruguayUzbekistanVenezuelaVietnamWest IndiesWestern AfricaWestern AsiaWestern EuropeYemenZaireZimbabweAzores
Pakistani
Race
Ancestry
AfghanAfricanAlaska NativeAlaskan AthabascanAlbanianAleutAlsatianAmericanApacheArabArapahoArgentineanArmenianAssyrian/Chaldean/SyriacAustralianAustrianBahamianBangladeshiBarbadianBasqueBelgianBelizeanBermudanBhutaneseBlackfeetBolivianBrazilianBritishBritish West IndianBulgarianBurmeseCajunCambodianCanadianCape VerdeanCarpatho RusynCelticCentral AmericanCentral American IndianCherokeeCheyenneChickasawChileanChineseChippewaChoctawColombianColvilleComancheCosta RicanCreeCreekCroatianCrowCubanCypriotCzechCzechoslovakianDanishDelawareDominicanDutchDutch West IndianEastern EuropeanEcuadorianEgyptianEnglishEstonianEthiopianEuropeanFijianFilipinoFinnishFrenchFrench American IndianFrench CanadianGermanGerman RussianGhanaianGreekGuamanian/ChamorroGuatemalanGuyaneseHaitianHmongHonduranHopiHoumaHungarianIcelanderIndian (Asian)IndonesianInupiatIranianIraqiIrishIroquoisIsraeliItalianJamaicanJapaneseJordanianKenyanKiowaKoreanLaotianLatvianLebaneseLiberianLithuanianLumbeeLuxembourgerMacedonianMalaysianMalteseMarshalleseMexicanMexican American IndianMongolianMoroccanNative HawaiianNavajoNepaleseNew ZealanderNicaraguanNigerianNorthern EuropeanNorwegianOkinawanOsageOttawaPaiutePakistaniPalestinianPanamanianParaguayanPennsylvania GermanPeruvianPimaPolishPortuguesePotawatomiPuebloPuerto RicanPuget Sound SalishRomanianRussianSalvadoranSamoanScandinavianScotch-IrishScottishSeminoleSenegaleseSerbianShoshoneSierra LeoneanSiouxSlavicSlovakSloveneSomaliSouth AfricanSouth AmericanSouth American IndianSoviet UnionSpaniardSpanishSpanish AmericanSpanish American IndianSri LankanSubsaharan AfricanSudaneseSwedishSwissSyrianTaiwaneseThaiTlingit-HaidaTohono O'OdhamTonganTrinidadian and TobagonianTsimshianTurkishU.S. Virgin IslanderUgandanUkrainianUruguayanUteVenezuelanVietnameseWelshWest IndianYakamaYaquiYugoslavianYumanYup'ikZimbabwean
Immigration
NonimmigrantsImmigrantsAfghanistanAfricaAlbaniaArgentinaArmeniaAsiaAustraliaAustriaBahamasBangladeshBarbadosBelarusBelgiumBelizeBoliviaBosnia and HerzegovinaBrazilBulgariaBurma/MyanmarCabo VerdeCambodiaCameroonCanadaCaribbeanCentral AmericaChileChinaColombiaCongoCosta RicaCroatiaCubaCzechoslovakiaDenmarkDominicaDominican RepublicEastern AfricaEastern AsiaEastern EuropeEcuadorEgyptEl SalvadorEnglandEritreaEthiopiaEuropeFijiFranceGermanyGhanaGreeceGrenadaGuatemalaGuyanaHaitiHondurasHong KongHungaryIndiaIndonesiaIranIraqIrelandIsraelItalyJamaicaJapanJordanKazakhstanKenyaKoreaKuwaitLaosLatin AmericaLatviaLebanonLiberiaLithuaniaMalaysiaMexicoMicronesiaMiddle AfricaMoldovaMoroccoNepalNetherlandsNicaraguaNigeriaNorth AmericaNorth MacedoniaNorthern AfricaNorthern EuropeNorwayOceaniaPakistanPanamaPeruPhilippinesPolandPortugalRomaniaRussiaSaudi ArabiaScotlandSenegalSerbiaSierra LeoneSingaporeSomaliaSouth AfricaSouth AmericaSouth Central AsiaSouth Eastern AsiaSouthern EuropeSpainSri LankaSt. Vincent and the GrenadinesSudanSwedenSwitzerlandSyriaTaiwanThailandTrinidad and TobagoTurkeyUgandaUkraineUruguayUzbekistanVenezuelaVietnamWest IndiesWestern AfricaWestern AsiaWestern EuropeYemenZaireZimbabweAzores
9th Grade
Income
Poverty
Unemployment
Labor Participation
Family Structure
Vehicle Availability
Education Level
Disability

9th Grade Comparison

Menominee

Pakistanis

Exceptional
Good
95.6%
9TH GRADE
98.3/ 100
METRIC RATING
99th/ 347
METRIC RANK
95.0%
9TH GRADE
64.1/ 100
METRIC RATING
163rd/ 347
METRIC RANK

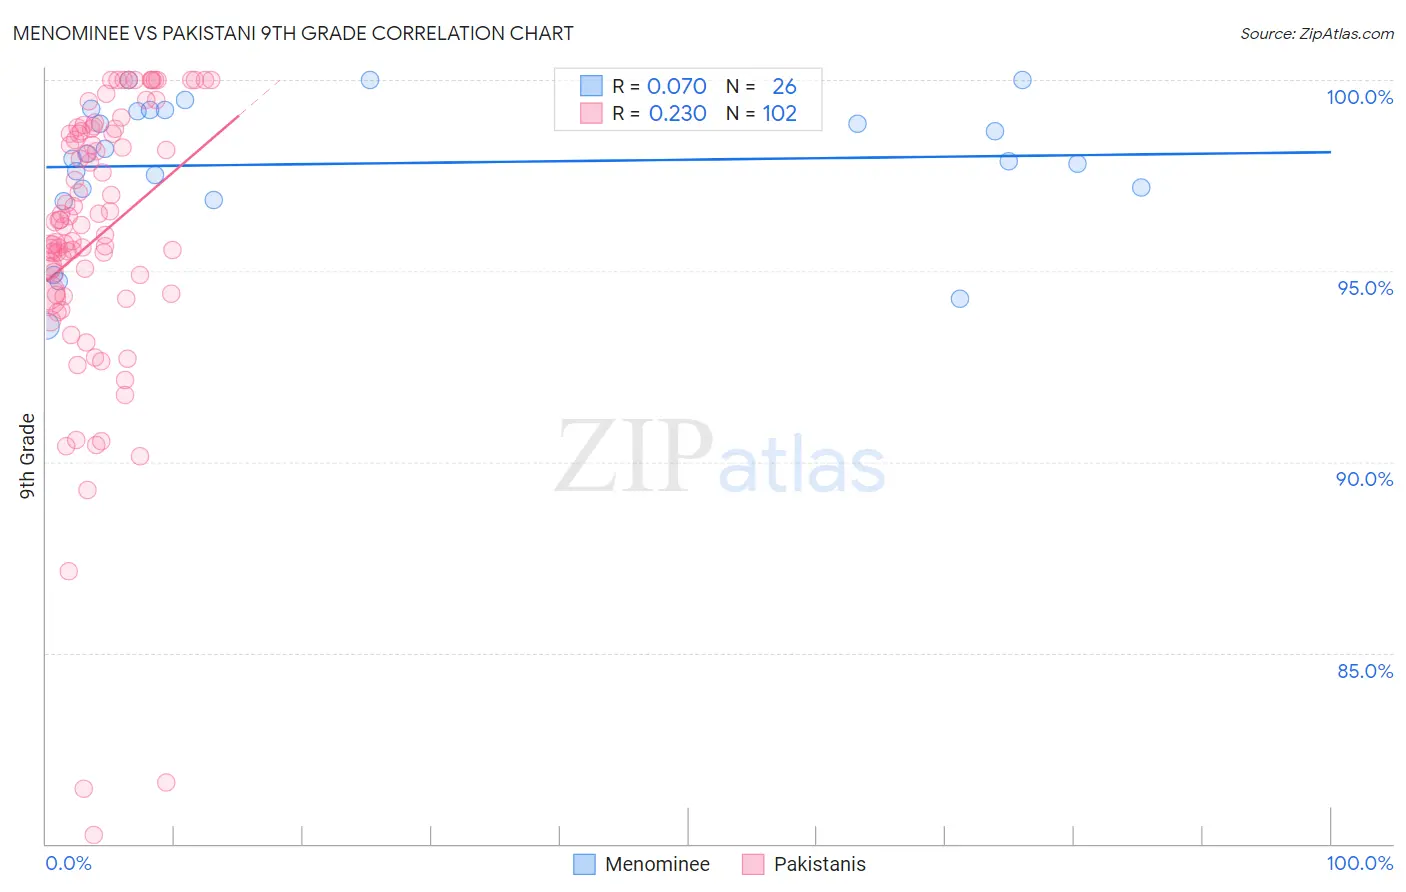
Menominee vs Pakistani 9th Grade Correlation Chart

The statistical analysis conducted on geographies consisting of 45,778,979 people shows a slight positive correlation between the proportion of Menominee and percentage of population with at least 9th grade education in the United States with a correlation coefficient (R) of 0.070 and weighted average of 95.6%. Similarly, the statistical analysis conducted on geographies consisting of 335,356,437 people shows a weak positive correlation between the proportion of Pakistanis and percentage of population with at least 9th grade education in the United States with a correlation coefficient (R) of 0.230 and weighted average of 95.0%, a difference of 0.64%.
Menominee vs Pakistani 9th Grade

9th Grade Correlation Summary

MeasurementMenomineePakistani
Minimum93.6%80.2%
Maximum100.0%100.0%
Range6.4%19.8%
Mean97.8%95.9%
Median98.0%96.3%
Interquartile 25% (IQ1)97.2%94.4%
Interquartile 75% (IQ3)99.2%98.7%
Interquartile Range (IQR)2.1%4.3%
Standard Deviation (Sample)1.8%3.8%
Standard Deviation (Population)1.7%3.8%

Similar Demographics by 9th Grade

Demographics Similar to Menominee by 9th Grade

In terms of 9th grade, the demographic groups most similar to Menominee are Immigrants from Japan (95.6%, a difference of 0.0%), Delaware (95.6%, a difference of 0.010%), American (95.6%, a difference of 0.020%), Filipino (95.6%, a difference of 0.020%), and Lebanese (95.6%, a difference of 0.020%).
DemographicsRating | Rank9th Grade
Immigrants | Saudi Arabia
98.8
/100
|
#92
Exceptional
95.6%
Immigrants | Germany
98.7
/100
|
#93
Exceptional
95.6%
Immigrants | Latvia
98.7
/100
|
#94
Exceptional
95.6%
Americans
98.5
/100
|
#95
Exceptional
95.6%
Filipinos
98.5
/100
|
#96
Exceptional
95.6%
Delaware
98.4
/100
|
#97
Exceptional
95.6%
Immigrants | Japan
98.4
/100
|
#98
Exceptional
95.6%
Menominee
98.3
/100
|
#99
Exceptional
95.6%
Lebanese
98.1
/100
|
#100
Exceptional
95.6%
Immigrants | Moldova
97.9
/100
|
#101
Exceptional
95.5%
Immigrants | Switzerland
97.7
/100
|
#102
Exceptional
95.5%
Potawatomi
97.7
/100
|
#103
Exceptional
95.5%
Syrians
97.4
/100
|
#104
Exceptional
95.5%
Immigrants | France
97.4
/100
|
#105
Exceptional
95.5%
Immigrants | Norway
97.1
/100
|
#106
Exceptional
95.5%

Demographics Similar to Pakistanis by 9th Grade

In terms of 9th grade, the demographic groups most similar to Pakistanis are Venezuelan (95.0%, a difference of 0.0%), Bermudan (95.0%, a difference of 0.010%), Blackfeet (95.0%, a difference of 0.010%), Ute (95.0%, a difference of 0.010%), and Immigrants from Italy (95.0%, a difference of 0.020%).
DemographicsRating | Rank9th Grade
Immigrants | Kenya
73.1
/100
|
#156
Good
95.0%
Mongolians
73.0
/100
|
#157
Good
95.0%
Egyptians
70.1
/100
|
#158
Good
95.0%
Immigrants | Ukraine
67.4
/100
|
#159
Good
95.0%
Immigrants | Italy
66.6
/100
|
#160
Good
95.0%
French American Indians
66.5
/100
|
#161
Good
95.0%
Bermudans
65.8
/100
|
#162
Good
95.0%
Pakistanis
64.1
/100
|
#163
Good
95.0%
Venezuelans
63.6
/100
|
#164
Good
95.0%
Blackfeet
62.6
/100
|
#165
Good
95.0%
Ute
62.6
/100
|
#166
Good
95.0%
Immigrants | Brazil
61.1
/100
|
#167
Good
95.0%
Chileans
60.7
/100
|
#168
Good
95.0%
Spaniards
59.6
/100
|
#169
Average
94.9%
Alsatians
58.6
/100
|
#170
Average
94.9%