Menominee vs Immigrants from Afghanistan No Schooling Completed
COMPARE
Menominee
Immigrants from Afghanistan
No Schooling Completed
No Schooling Completed Comparison
Menominee
Immigrants from Afghanistan
1.9%
NO SCHOOLING COMPLETED
89.6/ 100
METRIC RATING
134th/ 347
METRIC RANK
2.7%
NO SCHOOLING COMPLETED
0.0/ 100
METRIC RATING
287th/ 347
METRIC RANK
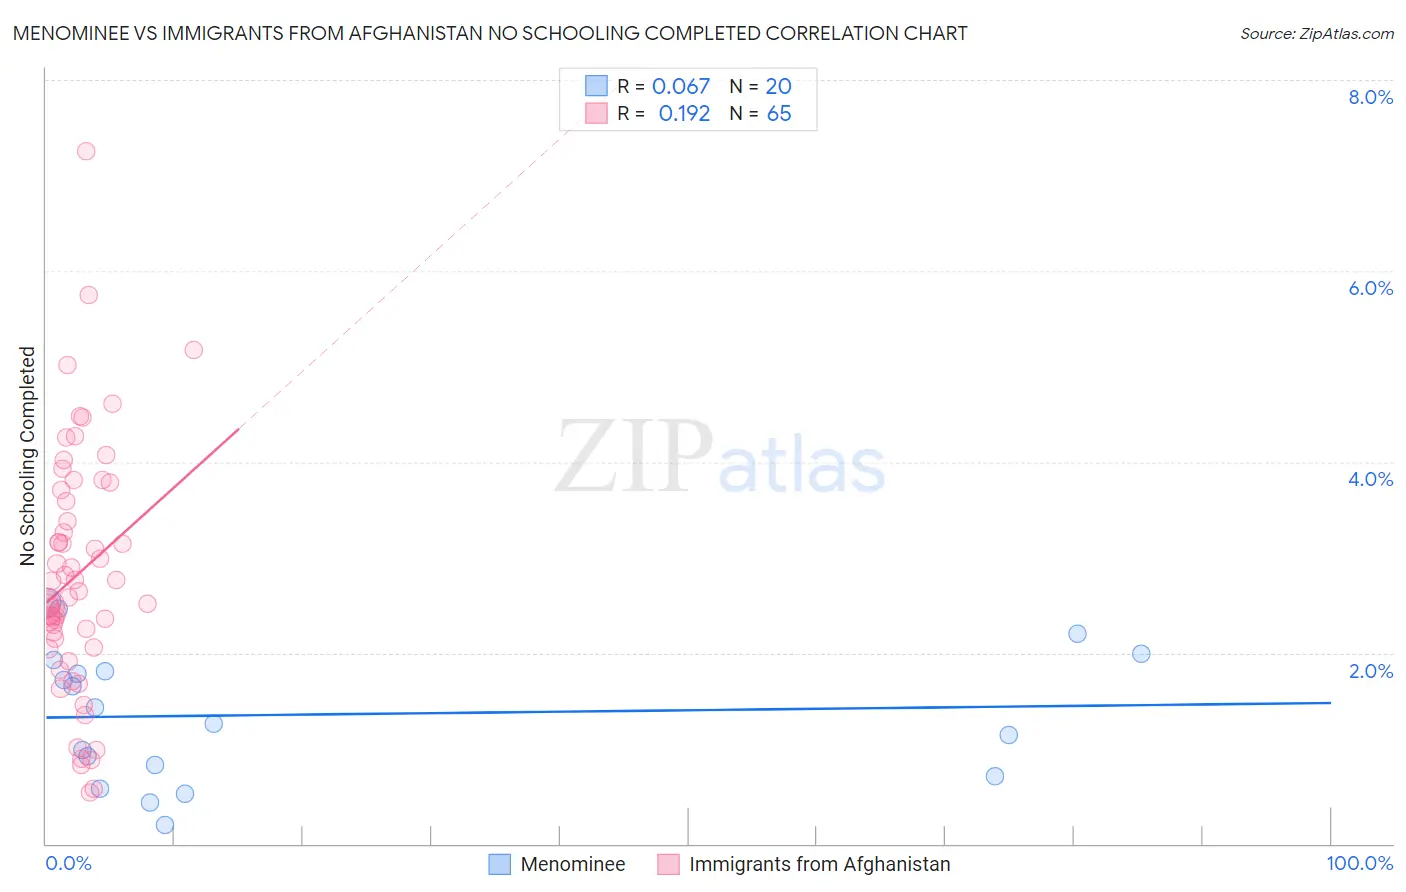
Menominee vs Immigrants from Afghanistan No Schooling Completed Correlation Chart
The statistical analysis conducted on geographies consisting of 45,688,108 people shows a slight positive correlation between the proportion of Menominee and percentage of population with no schooling in the United States with a correlation coefficient (R) of 0.067 and weighted average of 1.9%. Similarly, the statistical analysis conducted on geographies consisting of 147,353,456 people shows a poor positive correlation between the proportion of Immigrants from Afghanistan and percentage of population with no schooling in the United States with a correlation coefficient (R) of 0.192 and weighted average of 2.7%, a difference of 38.7%.
No Schooling Completed Correlation Summary
| Measurement | Menominee | Immigrants from Afghanistan |
| Minimum | 0.20% | 0.54% |
| Maximum | 2.5% | 7.2% |
| Range | 2.3% | 6.7% |
| Mean | 1.4% | 2.8% |
| Median | 1.3% | 2.6% |
| Interquartile 25% (IQ1) | 0.77% | 2.1% |
| Interquartile 75% (IQ3) | 1.9% | 3.6% |
| Interquartile Range (IQR) | 1.1% | 1.6% |
| Standard Deviation (Sample) | 0.70% | 1.3% |
| Standard Deviation (Population) | 0.68% | 1.3% |
Similar Demographics by No Schooling Completed
Demographics Similar to Menominee by No Schooling Completed
In terms of no schooling completed, the demographic groups most similar to Menominee are Immigrants from Turkey (1.9%, a difference of 0.25%), Colville (1.9%, a difference of 0.35%), Hmong (1.9%, a difference of 0.40%), Burmese (1.9%, a difference of 0.49%), and Immigrants from Hungary (1.9%, a difference of 0.85%).
| Demographics | Rating | Rank | No Schooling Completed |
| Israelis | 92.4 /100 | #127 | Exceptional 1.9% |
| Spaniards | 92.3 /100 | #128 | Exceptional 1.9% |
| Seminole | 92.0 /100 | #129 | Exceptional 1.9% |
| Palestinians | 91.8 /100 | #130 | Exceptional 1.9% |
| Immigrants | Hungary | 91.6 /100 | #131 | Exceptional 1.9% |
| Colville | 90.4 /100 | #132 | Exceptional 1.9% |
| Immigrants | Turkey | 90.2 /100 | #133 | Exceptional 1.9% |
| Menominee | 89.6 /100 | #134 | Excellent 1.9% |
| Hmong | 88.5 /100 | #135 | Excellent 1.9% |
| Burmese | 88.2 /100 | #136 | Excellent 1.9% |
| Filipinos | 85.5 /100 | #137 | Excellent 2.0% |
| Immigrants | Israel | 85.4 /100 | #138 | Excellent 2.0% |
| Jordanians | 84.5 /100 | #139 | Excellent 2.0% |
| Marshallese | 83.5 /100 | #140 | Excellent 2.0% |
| Immigrants | Greece | 83.5 /100 | #141 | Excellent 2.0% |
Demographics Similar to Immigrants from Afghanistan by No Schooling Completed
In terms of no schooling completed, the demographic groups most similar to Immigrants from Afghanistan are Immigrants from St. Vincent and the Grenadines (2.7%, a difference of 0.10%), Immigrants from Thailand (2.7%, a difference of 0.42%), Immigrants from Hong Kong (2.7%, a difference of 0.48%), Immigrants from Portugal (2.7%, a difference of 0.81%), and Immigrants from Barbados (2.7%, a difference of 1.2%).
| Demographics | Rating | Rank | No Schooling Completed |
| Trinidadians and Tobagonians | 0.1 /100 | #280 | Tragic 2.6% |
| Afghans | 0.1 /100 | #281 | Tragic 2.6% |
| Immigrants | Ghana | 0.1 /100 | #282 | Tragic 2.6% |
| Immigrants | Trinidad and Tobago | 0.0 /100 | #283 | Tragic 2.6% |
| Immigrants | West Indies | 0.0 /100 | #284 | Tragic 2.7% |
| Immigrants | Barbados | 0.0 /100 | #285 | Tragic 2.7% |
| Immigrants | Portugal | 0.0 /100 | #286 | Tragic 2.7% |
| Immigrants | Afghanistan | 0.0 /100 | #287 | Tragic 2.7% |
| Immigrants | St. Vincent and the Grenadines | 0.0 /100 | #288 | Tragic 2.7% |
| Immigrants | Thailand | 0.0 /100 | #289 | Tragic 2.7% |
| Immigrants | Hong Kong | 0.0 /100 | #290 | Tragic 2.7% |
| British West Indians | 0.0 /100 | #291 | Tragic 2.7% |
| Immigrants | Grenada | 0.0 /100 | #292 | Tragic 2.8% |
| Malaysians | 0.0 /100 | #293 | Tragic 2.8% |
| Immigrants | Eritrea | 0.0 /100 | #294 | Tragic 2.8% |