Menominee vs Basque College, 1 year or more
COMPARE
Menominee
Basque
College, 1 year or more
College, 1 year or more Comparison
Menominee
Basques
50.6%
COLLEGE, 1 YEAR OR MORE
0.0/ 100
METRIC RATING
327th/ 347
METRIC RANK
60.9%
COLLEGE, 1 YEAR OR MORE
87.2/ 100
METRIC RATING
136th/ 347
METRIC RANK
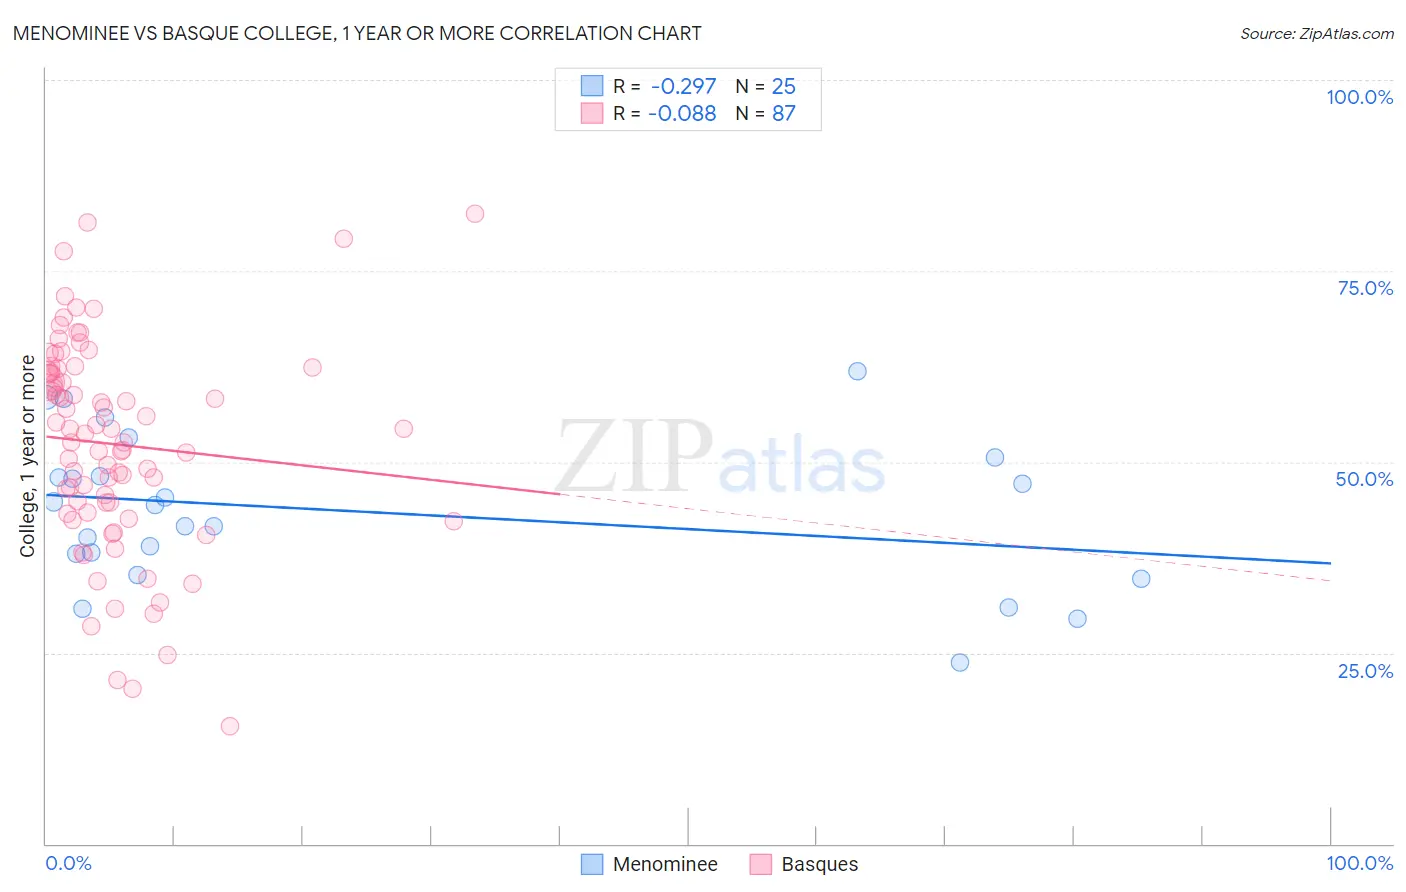
Menominee vs Basque College, 1 year or more Correlation Chart
The statistical analysis conducted on geographies consisting of 45,778,860 people shows a weak negative correlation between the proportion of Menominee and percentage of population with at least college, 1 year or more education in the United States with a correlation coefficient (R) of -0.297 and weighted average of 50.6%. Similarly, the statistical analysis conducted on geographies consisting of 165,778,610 people shows a slight negative correlation between the proportion of Basques and percentage of population with at least college, 1 year or more education in the United States with a correlation coefficient (R) of -0.088 and weighted average of 60.9%, a difference of 20.5%.
College, 1 year or more Correlation Summary
| Measurement | Menominee | Basque |
| Minimum | 23.8% | 15.4% |
| Maximum | 61.9% | 82.5% |
| Range | 38.1% | 67.1% |
| Mean | 43.5% | 52.3% |
| Median | 44.3% | 53.6% |
| Interquartile 25% (IQ1) | 36.6% | 43.4% |
| Interquartile 75% (IQ3) | 49.3% | 61.8% |
| Interquartile Range (IQR) | 12.7% | 18.4% |
| Standard Deviation (Sample) | 9.8% | 13.7% |
| Standard Deviation (Population) | 9.6% | 13.7% |
Similar Demographics by College, 1 year or more
Demographics Similar to Menominee by College, 1 year or more
In terms of college, 1 year or more, the demographic groups most similar to Menominee are Dominican (50.6%, a difference of 0.040%), Dutch West Indian (50.5%, a difference of 0.12%), Immigrants from Latin America (50.7%, a difference of 0.22%), Immigrants from Cuba (50.7%, a difference of 0.25%), and Immigrants from Guatemala (50.7%, a difference of 0.26%).
| Demographics | Rating | Rank | College, 1 year or more |
| Kiowa | 0.0 /100 | #320 | Tragic 51.0% |
| Hopi | 0.0 /100 | #321 | Tragic 50.9% |
| Navajo | 0.0 /100 | #322 | Tragic 50.8% |
| Immigrants | Guatemala | 0.0 /100 | #323 | Tragic 50.7% |
| Immigrants | Cuba | 0.0 /100 | #324 | Tragic 50.7% |
| Immigrants | Latin America | 0.0 /100 | #325 | Tragic 50.7% |
| Dominicans | 0.0 /100 | #326 | Tragic 50.6% |
| Menominee | 0.0 /100 | #327 | Tragic 50.6% |
| Dutch West Indians | 0.0 /100 | #328 | Tragic 50.5% |
| Cape Verdeans | 0.0 /100 | #329 | Tragic 50.3% |
| Natives/Alaskans | 0.0 /100 | #330 | Tragic 50.2% |
| Immigrants | Yemen | 0.0 /100 | #331 | Tragic 50.0% |
| Mexicans | 0.0 /100 | #332 | Tragic 49.2% |
| Immigrants | Dominican Republic | 0.0 /100 | #333 | Tragic 49.1% |
| Lumbee | 0.0 /100 | #334 | Tragic 48.9% |
Demographics Similar to Basques by College, 1 year or more
In terms of college, 1 year or more, the demographic groups most similar to Basques are Immigrants from Uganda (60.9%, a difference of 0.020%), Immigrants from Venezuela (61.0%, a difference of 0.080%), Immigrants from Uzbekistan (61.0%, a difference of 0.090%), Slovene (60.9%, a difference of 0.090%), and Scandinavian (61.0%, a difference of 0.12%).
| Demographics | Rating | Rank | College, 1 year or more |
| Ugandans | 90.7 /100 | #129 | Exceptional 61.2% |
| Italians | 89.5 /100 | #130 | Excellent 61.1% |
| Immigrants | Morocco | 89.5 /100 | #131 | Excellent 61.1% |
| Scandinavians | 88.2 /100 | #132 | Excellent 61.0% |
| Immigrants | Uzbekistan | 88.0 /100 | #133 | Excellent 61.0% |
| Immigrants | Venezuela | 87.9 /100 | #134 | Excellent 61.0% |
| Immigrants | Uganda | 87.4 /100 | #135 | Excellent 60.9% |
| Basques | 87.2 /100 | #136 | Excellent 60.9% |
| Slovenes | 86.5 /100 | #137 | Excellent 60.9% |
| Taiwanese | 84.3 /100 | #138 | Excellent 60.7% |
| Immigrants | Eritrea | 84.3 /100 | #139 | Excellent 60.7% |
| Iraqis | 83.3 /100 | #140 | Excellent 60.7% |
| Immigrants | Afghanistan | 83.1 /100 | #141 | Excellent 60.7% |
| Poles | 82.8 /100 | #142 | Excellent 60.7% |
| Canadians | 82.7 /100 | #143 | Excellent 60.6% |