Marshallese vs Thai Master's Degree
COMPARE
Marshallese
Thai
Master's Degree
Master's Degree Comparison
Marshallese
Thais
11.6%
MASTER'S DEGREE
0.1/ 100
METRIC RATING
295th/ 347
METRIC RANK
21.7%
MASTER'S DEGREE
100.0/ 100
METRIC RATING
9th/ 347
METRIC RANK
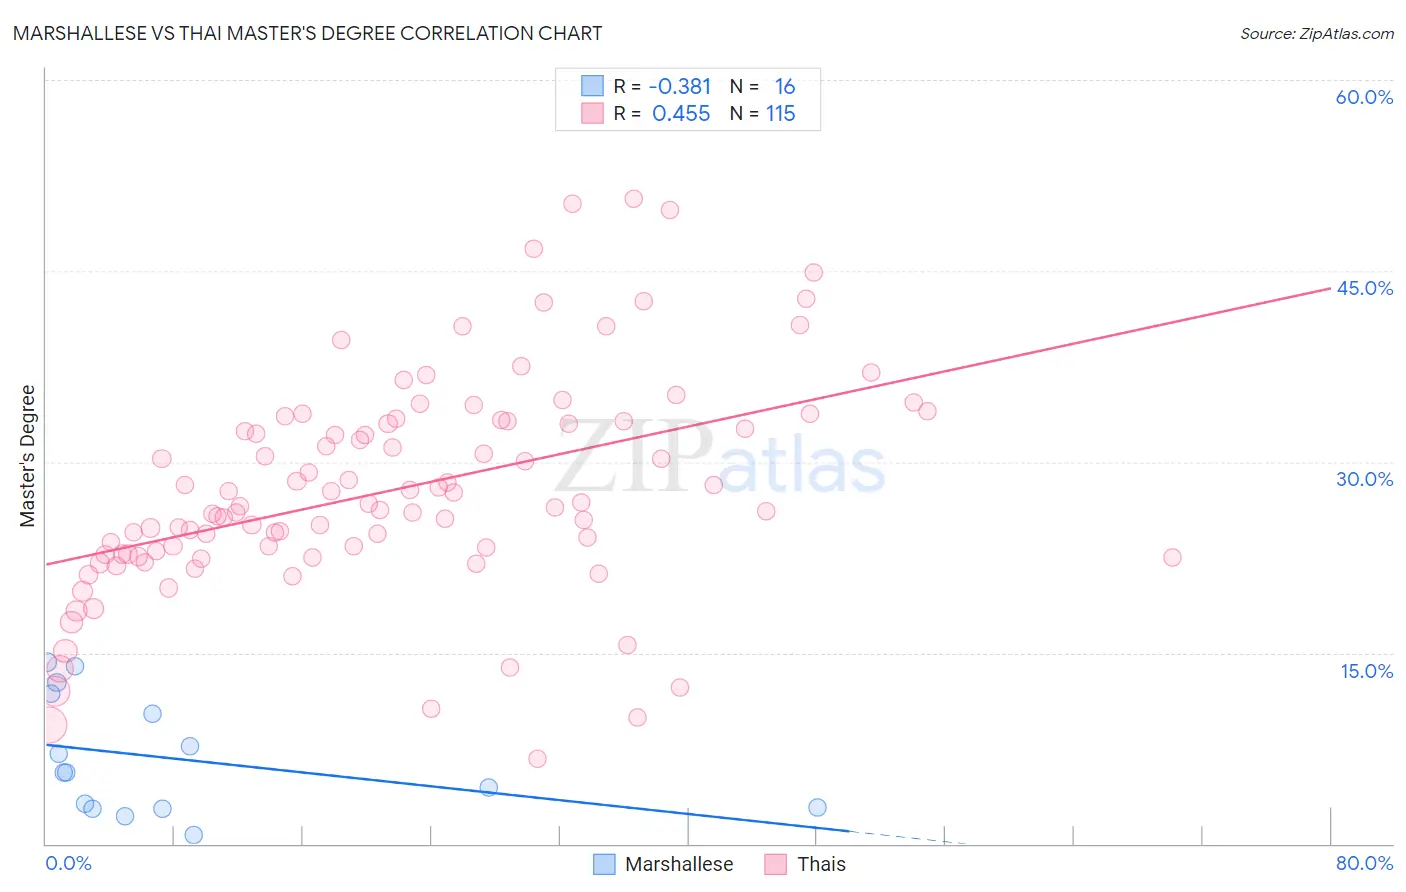
Marshallese vs Thai Master's Degree Correlation Chart
The statistical analysis conducted on geographies consisting of 14,761,315 people shows a mild negative correlation between the proportion of Marshallese and percentage of population with at least master's degree education in the United States with a correlation coefficient (R) of -0.381 and weighted average of 11.6%. Similarly, the statistical analysis conducted on geographies consisting of 475,625,937 people shows a moderate positive correlation between the proportion of Thais and percentage of population with at least master's degree education in the United States with a correlation coefficient (R) of 0.455 and weighted average of 21.7%, a difference of 87.7%.
Master's Degree Correlation Summary
| Measurement | Marshallese | Thai |
| Minimum | 0.68% | 6.7% |
| Maximum | 14.2% | 50.7% |
| Range | 13.6% | 44.0% |
| Mean | 6.7% | 27.8% |
| Median | 5.6% | 26.5% |
| Interquartile 25% (IQ1) | 2.8% | 22.7% |
| Interquartile 75% (IQ3) | 11.0% | 33.2% |
| Interquartile Range (IQR) | 8.2% | 10.4% |
| Standard Deviation (Sample) | 4.5% | 8.5% |
| Standard Deviation (Population) | 4.4% | 8.5% |
Similar Demographics by Master's Degree
Demographics Similar to Marshallese by Master's Degree
In terms of master's degree, the demographic groups most similar to Marshallese are Alaskan Athabascan (11.6%, a difference of 0.010%), Immigrants from Yemen (11.6%, a difference of 0.13%), Hawaiian (11.6%, a difference of 0.15%), Alaska Native (11.6%, a difference of 0.25%), and Immigrants from Guatemala (11.6%, a difference of 0.48%).
| Demographics | Rating | Rank | Master's Degree |
| Immigrants | Honduras | 0.1 /100 | #288 | Tragic 11.8% |
| Guatemalans | 0.1 /100 | #289 | Tragic 11.7% |
| Ute | 0.1 /100 | #290 | Tragic 11.7% |
| Colville | 0.1 /100 | #291 | Tragic 11.6% |
| Immigrants | Guatemala | 0.1 /100 | #292 | Tragic 11.6% |
| Alaska Natives | 0.1 /100 | #293 | Tragic 11.6% |
| Hawaiians | 0.1 /100 | #294 | Tragic 11.6% |
| Marshallese | 0.1 /100 | #295 | Tragic 11.6% |
| Alaskan Athabascans | 0.1 /100 | #296 | Tragic 11.6% |
| Immigrants | Yemen | 0.1 /100 | #297 | Tragic 11.6% |
| Samoans | 0.1 /100 | #298 | Tragic 11.5% |
| Chickasaw | 0.1 /100 | #299 | Tragic 11.4% |
| Chippewa | 0.1 /100 | #300 | Tragic 11.4% |
| Tsimshian | 0.1 /100 | #301 | Tragic 11.4% |
| Cherokee | 0.1 /100 | #302 | Tragic 11.4% |
Demographics Similar to Thais by Master's Degree
In terms of master's degree, the demographic groups most similar to Thais are Cypriot (21.8%, a difference of 0.34%), Immigrants from Iran (21.6%, a difference of 0.41%), Immigrants from China (21.2%, a difference of 2.5%), Iranian (22.3%, a difference of 2.5%), and Immigrants from India (22.3%, a difference of 2.8%).
| Demographics | Rating | Rank | Master's Degree |
| Filipinos | 100.0 /100 | #2 | Exceptional 23.4% |
| Immigrants | Israel | 100.0 /100 | #3 | Exceptional 22.6% |
| Okinawans | 100.0 /100 | #4 | Exceptional 22.6% |
| Immigrants | Taiwan | 100.0 /100 | #5 | Exceptional 22.5% |
| Immigrants | India | 100.0 /100 | #6 | Exceptional 22.3% |
| Iranians | 100.0 /100 | #7 | Exceptional 22.3% |
| Cypriots | 100.0 /100 | #8 | Exceptional 21.8% |
| Thais | 100.0 /100 | #9 | Exceptional 21.7% |
| Immigrants | Iran | 100.0 /100 | #10 | Exceptional 21.6% |
| Immigrants | China | 100.0 /100 | #11 | Exceptional 21.2% |
| Eastern Europeans | 100.0 /100 | #12 | Exceptional 21.1% |
| Immigrants | Australia | 100.0 /100 | #13 | Exceptional 20.9% |
| Immigrants | Switzerland | 100.0 /100 | #14 | Exceptional 20.9% |
| Immigrants | Eastern Asia | 100.0 /100 | #15 | Exceptional 20.8% |
| Immigrants | Belgium | 100.0 /100 | #16 | Exceptional 20.8% |