Marshallese vs Immigrants from Egypt 1st Grade
COMPARE
Marshallese
Immigrants from Egypt
1st Grade
1st Grade Comparison
Marshallese
Immigrants from Egypt
98.0%
1ST GRADE
82.0/ 100
METRIC RATING
142nd/ 347
METRIC RANK
97.8%
1ST GRADE
22.6/ 100
METRIC RATING
200th/ 347
METRIC RANK
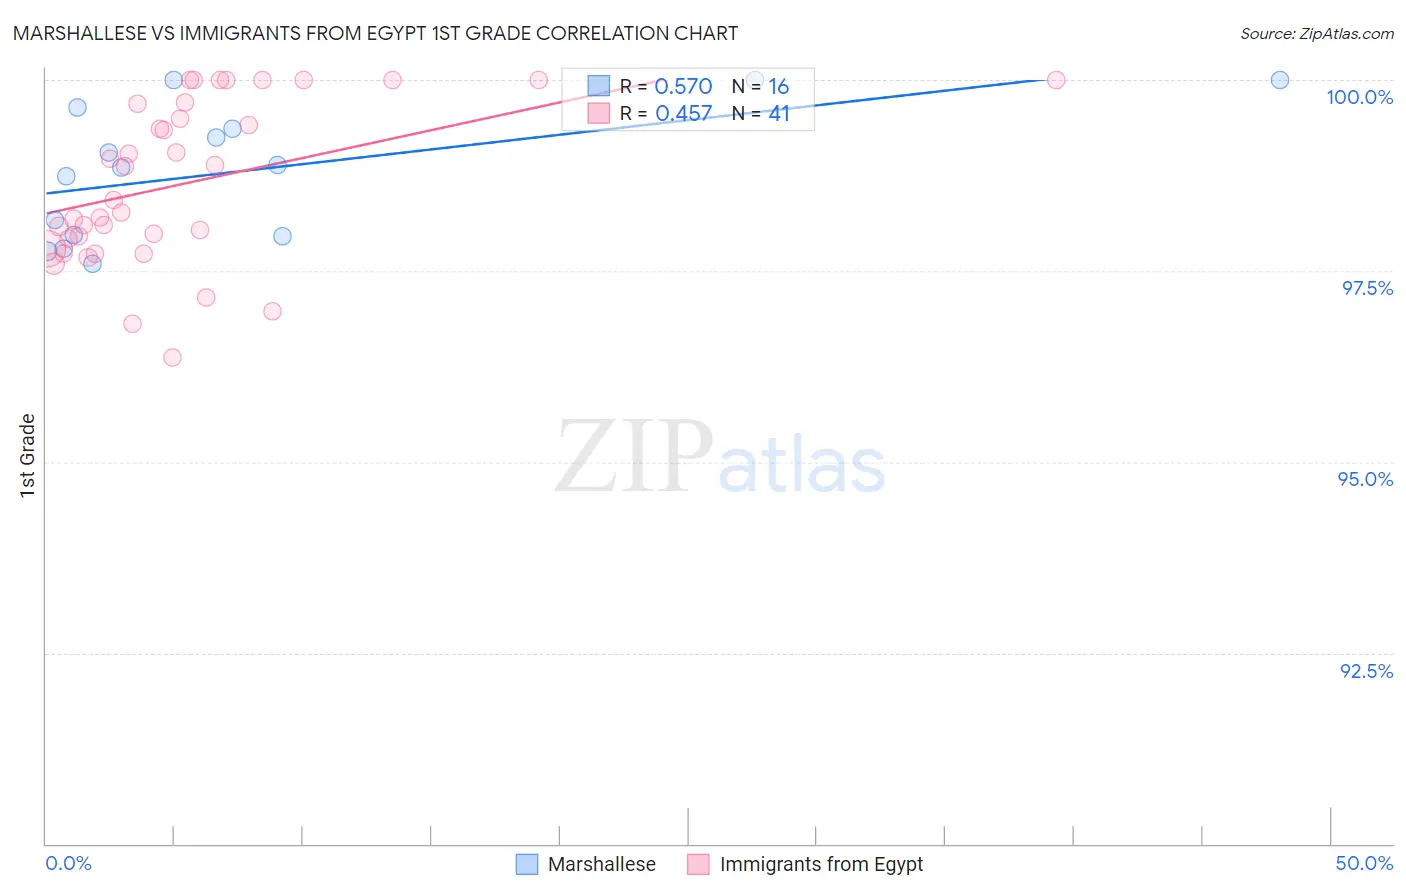
Marshallese vs Immigrants from Egypt 1st Grade Correlation Chart
The statistical analysis conducted on geographies consisting of 14,761,315 people shows a substantial positive correlation between the proportion of Marshallese and percentage of population with at least 1st grade education in the United States with a correlation coefficient (R) of 0.570 and weighted average of 98.0%. Similarly, the statistical analysis conducted on geographies consisting of 245,485,794 people shows a moderate positive correlation between the proportion of Immigrants from Egypt and percentage of population with at least 1st grade education in the United States with a correlation coefficient (R) of 0.457 and weighted average of 97.8%, a difference of 0.21%.
1st Grade Correlation Summary
| Measurement | Marshallese | Immigrants from Egypt |
| Minimum | 97.6% | 96.4% |
| Maximum | 100.0% | 100.0% |
| Range | 2.4% | 3.6% |
| Mean | 98.8% | 98.6% |
| Median | 98.9% | 98.4% |
| Interquartile 25% (IQ1) | 98.0% | 97.9% |
| Interquartile 75% (IQ3) | 99.5% | 99.7% |
| Interquartile Range (IQR) | 1.5% | 1.8% |
| Standard Deviation (Sample) | 0.86% | 1.0% |
| Standard Deviation (Population) | 0.83% | 1.0% |
Similar Demographics by 1st Grade
Demographics Similar to Marshallese by 1st Grade
In terms of 1st grade, the demographic groups most similar to Marshallese are Immigrants from Turkey (98.0%, a difference of 0.0%), Palestinian (98.0%, a difference of 0.010%), Burmese (98.0%, a difference of 0.010%), Alsatian (98.0%, a difference of 0.010%), and Hmong (98.0%, a difference of 0.010%).
| Demographics | Rating | Rank | 1st Grade |
| Immigrants | Kuwait | 89.3 /100 | #135 | Excellent 98.1% |
| Immigrants | Bulgaria | 88.8 /100 | #136 | Excellent 98.1% |
| Israelis | 87.8 /100 | #137 | Excellent 98.1% |
| Immigrants | Romania | 87.8 /100 | #138 | Excellent 98.1% |
| Blackfeet | 87.6 /100 | #139 | Excellent 98.1% |
| Palestinians | 83.0 /100 | #140 | Excellent 98.0% |
| Immigrants | Turkey | 82.8 /100 | #141 | Excellent 98.0% |
| Marshallese | 82.0 /100 | #142 | Excellent 98.0% |
| Burmese | 81.0 /100 | #143 | Excellent 98.0% |
| Alsatians | 80.9 /100 | #144 | Excellent 98.0% |
| Hmong | 79.0 /100 | #145 | Good 98.0% |
| Immigrants | Israel | 77.8 /100 | #146 | Good 98.0% |
| Filipinos | 77.6 /100 | #147 | Good 98.0% |
| Apache | 75.2 /100 | #148 | Good 98.0% |
| Immigrants | Greece | 74.9 /100 | #149 | Good 98.0% |
Demographics Similar to Immigrants from Egypt by 1st Grade
In terms of 1st grade, the demographic groups most similar to Immigrants from Egypt are Tohono O'odham (97.8%, a difference of 0.0%), Yuman (97.8%, a difference of 0.010%), Immigrants from Lebanon (97.8%, a difference of 0.010%), Immigrants from Kenya (97.8%, a difference of 0.020%), and Guamanian/Chamorro (97.8%, a difference of 0.020%).
| Demographics | Rating | Rank | 1st Grade |
| Immigrants | Taiwan | 29.4 /100 | #193 | Fair 97.9% |
| Mongolians | 29.2 /100 | #194 | Fair 97.9% |
| Hawaiians | 28.8 /100 | #195 | Fair 97.9% |
| Immigrants | Kenya | 26.3 /100 | #196 | Fair 97.8% |
| Guamanians/Chamorros | 26.2 /100 | #197 | Fair 97.8% |
| Yuman | 24.4 /100 | #198 | Fair 97.8% |
| Tohono O'odham | 23.2 /100 | #199 | Fair 97.8% |
| Immigrants | Egypt | 22.6 /100 | #200 | Fair 97.8% |
| Immigrants | Lebanon | 20.1 /100 | #201 | Fair 97.8% |
| Immigrants | Ukraine | 19.2 /100 | #202 | Poor 97.8% |
| Immigrants | Southern Europe | 18.2 /100 | #203 | Poor 97.8% |
| Immigrants | Uganda | 18.2 /100 | #204 | Poor 97.8% |
| Immigrants | Chile | 17.7 /100 | #205 | Poor 97.8% |
| Immigrants | Albania | 17.3 /100 | #206 | Poor 97.8% |
| Africans | 16.5 /100 | #207 | Poor 97.8% |