Marshallese vs Immigrants from Dominican Republic High School Diploma
COMPARE
Marshallese
Immigrants from Dominican Republic
High School Diploma
High School Diploma Comparison
Marshallese
Immigrants from Dominican Republic
88.6%
HIGH SCHOOL DIPLOMA
18.7/ 100
METRIC RATING
199th/ 347
METRIC RANK
82.0%
HIGH SCHOOL DIPLOMA
0.0/ 100
METRIC RATING
336th/ 347
METRIC RANK
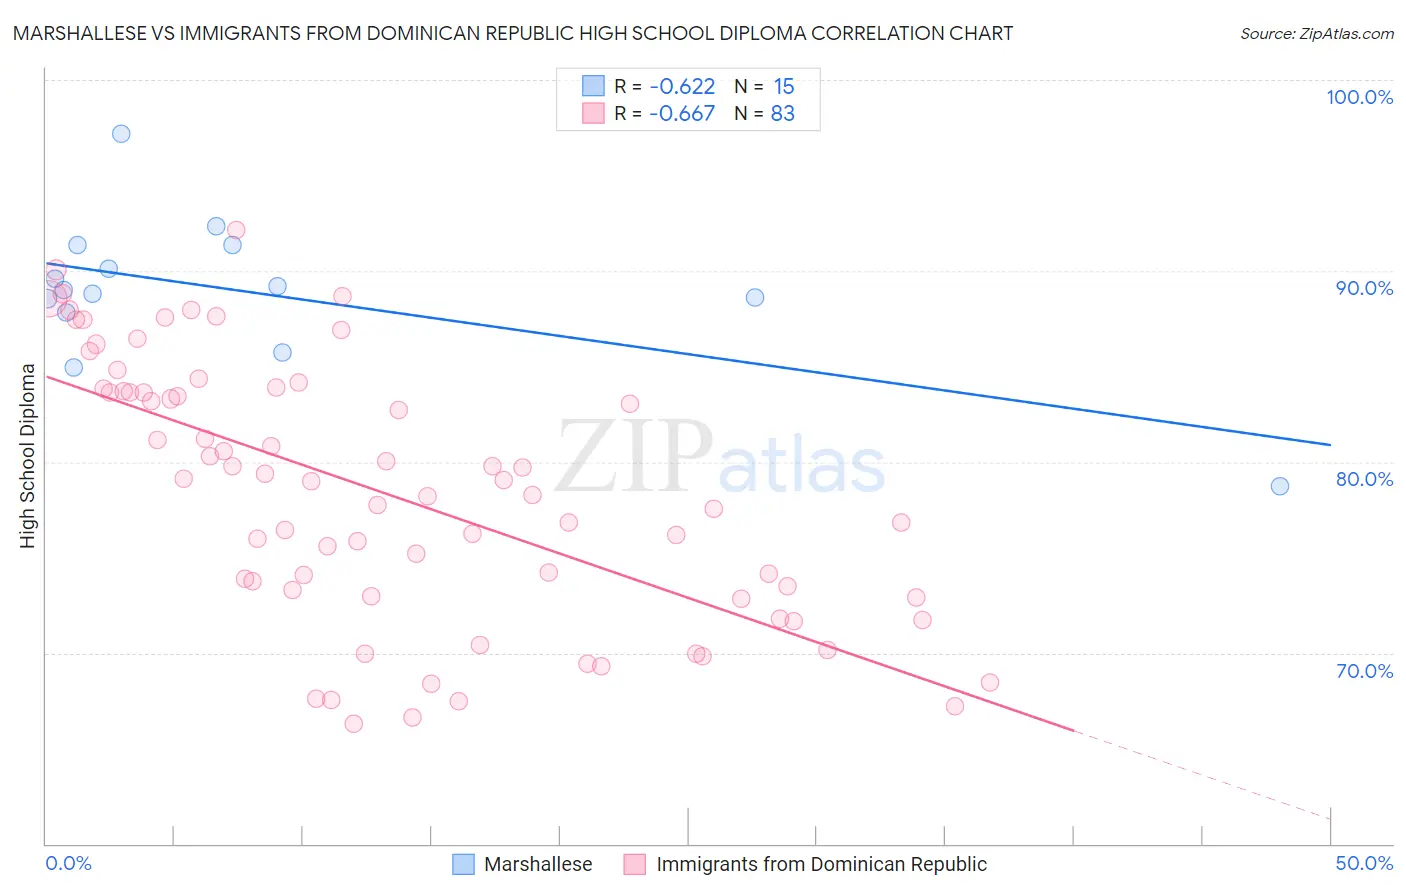
Marshallese vs Immigrants from Dominican Republic High School Diploma Correlation Chart
The statistical analysis conducted on geographies consisting of 14,760,991 people shows a significant negative correlation between the proportion of Marshallese and percentage of population with at least high school diploma education in the United States with a correlation coefficient (R) of -0.622 and weighted average of 88.6%. Similarly, the statistical analysis conducted on geographies consisting of 275,144,349 people shows a significant negative correlation between the proportion of Immigrants from Dominican Republic and percentage of population with at least high school diploma education in the United States with a correlation coefficient (R) of -0.667 and weighted average of 82.0%, a difference of 8.2%.
High School Diploma Correlation Summary
| Measurement | Marshallese | Immigrants from Dominican Republic |
| Minimum | 78.7% | 66.3% |
| Maximum | 97.2% | 92.2% |
| Range | 18.5% | 25.9% |
| Mean | 88.9% | 78.4% |
| Median | 89.0% | 79.0% |
| Interquartile 25% (IQ1) | 87.8% | 73.0% |
| Interquartile 75% (IQ3) | 91.3% | 83.7% |
| Interquartile Range (IQR) | 3.5% | 10.8% |
| Standard Deviation (Sample) | 4.0% | 6.8% |
| Standard Deviation (Population) | 3.9% | 6.7% |
Similar Demographics by High School Diploma
Demographics Similar to Marshallese by High School Diploma
In terms of high school diploma, the demographic groups most similar to Marshallese are Liberian (88.7%, a difference of 0.0%), Hawaiian (88.6%, a difference of 0.010%), Korean (88.6%, a difference of 0.010%), Panamanian (88.6%, a difference of 0.020%), and Somali (88.6%, a difference of 0.030%).
| Demographics | Rating | Rank | High School Diploma |
| Moroccans | 29.5 /100 | #192 | Fair 88.8% |
| Immigrants | Oceania | 26.9 /100 | #193 | Fair 88.8% |
| Immigrants | Venezuela | 25.8 /100 | #194 | Fair 88.8% |
| Afghans | 23.9 /100 | #195 | Fair 88.8% |
| Immigrants | Southern Europe | 23.4 /100 | #196 | Fair 88.7% |
| French American Indians | 21.5 /100 | #197 | Fair 88.7% |
| Liberians | 18.8 /100 | #198 | Poor 88.7% |
| Marshallese | 18.7 /100 | #199 | Poor 88.6% |
| Hawaiians | 18.3 /100 | #200 | Poor 88.6% |
| Koreans | 18.1 /100 | #201 | Poor 88.6% |
| Panamanians | 18.0 /100 | #202 | Poor 88.6% |
| Somalis | 17.5 /100 | #203 | Poor 88.6% |
| Armenians | 17.2 /100 | #204 | Poor 88.6% |
| Immigrants | Micronesia | 16.4 /100 | #205 | Poor 88.6% |
| Arapaho | 16.1 /100 | #206 | Poor 88.6% |
Demographics Similar to Immigrants from Dominican Republic by High School Diploma
In terms of high school diploma, the demographic groups most similar to Immigrants from Dominican Republic are Guatemalan (82.0%, a difference of 0.010%), Tohono O'odham (82.1%, a difference of 0.12%), Immigrants from Yemen (81.8%, a difference of 0.15%), Immigrants from Latin America (82.1%, a difference of 0.23%), and Salvadoran (81.7%, a difference of 0.32%).
| Demographics | Rating | Rank | High School Diploma |
| Hispanics or Latinos | 0.0 /100 | #329 | Tragic 82.9% |
| Immigrants | Azores | 0.0 /100 | #330 | Tragic 82.8% |
| Central Americans | 0.0 /100 | #331 | Tragic 82.5% |
| Immigrants | Honduras | 0.0 /100 | #332 | Tragic 82.5% |
| Immigrants | Latin America | 0.0 /100 | #333 | Tragic 82.1% |
| Tohono O'odham | 0.0 /100 | #334 | Tragic 82.1% |
| Guatemalans | 0.0 /100 | #335 | Tragic 82.0% |
| Immigrants | Dominican Republic | 0.0 /100 | #336 | Tragic 82.0% |
| Immigrants | Yemen | 0.0 /100 | #337 | Tragic 81.8% |
| Salvadorans | 0.0 /100 | #338 | Tragic 81.7% |
| Pima | 0.0 /100 | #339 | Tragic 81.6% |
| Houma | 0.0 /100 | #340 | Tragic 81.5% |
| Mexicans | 0.0 /100 | #341 | Tragic 81.4% |
| Immigrants | Guatemala | 0.0 /100 | #342 | Tragic 81.4% |
| Immigrants | El Salvador | 0.0 /100 | #343 | Tragic 80.8% |