Maltese vs South American Indian No Schooling Completed
COMPARE
Maltese
South American Indian
No Schooling Completed
No Schooling Completed Comparison
Maltese
South American Indians
1.6%
NO SCHOOLING COMPLETED
99.9/ 100
METRIC RATING
46th/ 347
METRIC RANK
2.2%
NO SCHOOLING COMPLETED
11.0/ 100
METRIC RATING
207th/ 347
METRIC RANK
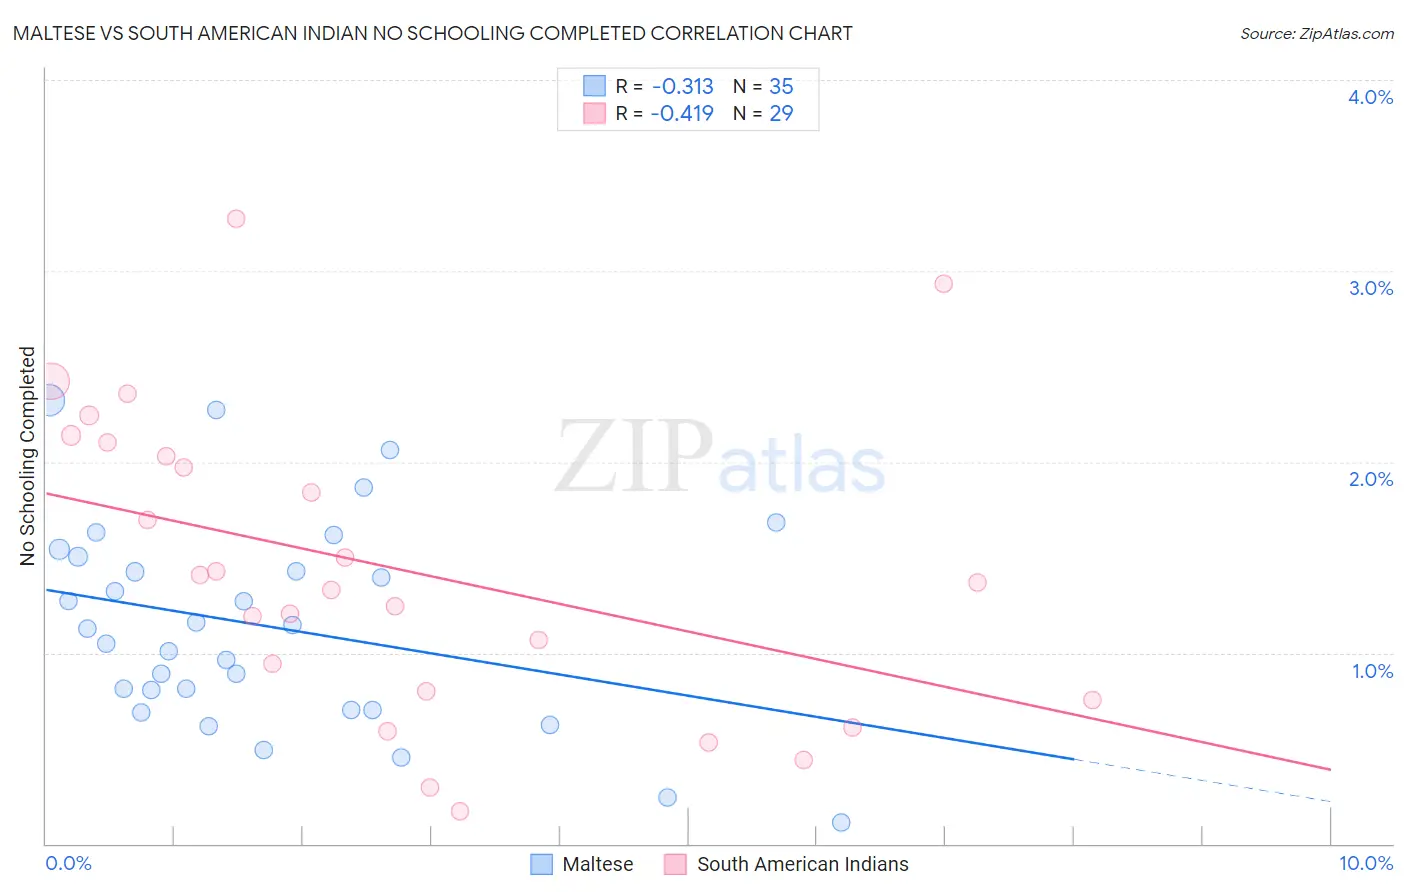
Maltese vs South American Indian No Schooling Completed Correlation Chart
The statistical analysis conducted on geographies consisting of 126,020,620 people shows a mild negative correlation between the proportion of Maltese and percentage of population with no schooling in the United States with a correlation coefficient (R) of -0.313 and weighted average of 1.6%. Similarly, the statistical analysis conducted on geographies consisting of 164,141,114 people shows a moderate negative correlation between the proportion of South American Indians and percentage of population with no schooling in the United States with a correlation coefficient (R) of -0.419 and weighted average of 2.2%, a difference of 37.9%.
No Schooling Completed Correlation Summary
| Measurement | Maltese | South American Indian |
| Minimum | 0.11% | 0.17% |
| Maximum | 2.3% | 3.3% |
| Range | 2.2% | 3.1% |
| Mean | 1.1% | 1.4% |
| Median | 1.1% | 1.4% |
| Interquartile 25% (IQ1) | 0.70% | 0.77% |
| Interquartile 75% (IQ3) | 1.5% | 2.1% |
| Interquartile Range (IQR) | 0.80% | 1.3% |
| Standard Deviation (Sample) | 0.54% | 0.79% |
| Standard Deviation (Population) | 0.53% | 0.78% |
Similar Demographics by No Schooling Completed
Demographics Similar to Maltese by No Schooling Completed
In terms of no schooling completed, the demographic groups most similar to Maltese are Czechoslovakian (1.6%, a difference of 0.090%), Estonian (1.6%, a difference of 0.13%), Ottawa (1.6%, a difference of 0.14%), Australian (1.6%, a difference of 0.32%), and Immigrants from Scotland (1.6%, a difference of 0.40%).
| Demographics | Rating | Rank | No Schooling Completed |
| Native Hawaiians | 99.9 /100 | #39 | Exceptional 1.6% |
| Luxembourgers | 99.9 /100 | #40 | Exceptional 1.6% |
| Hungarians | 99.9 /100 | #41 | Exceptional 1.6% |
| Bulgarians | 99.9 /100 | #42 | Exceptional 1.6% |
| Australians | 99.9 /100 | #43 | Exceptional 1.6% |
| Estonians | 99.9 /100 | #44 | Exceptional 1.6% |
| Czechoslovakians | 99.9 /100 | #45 | Exceptional 1.6% |
| Maltese | 99.9 /100 | #46 | Exceptional 1.6% |
| Ottawa | 99.9 /100 | #47 | Exceptional 1.6% |
| Immigrants | Scotland | 99.9 /100 | #48 | Exceptional 1.6% |
| Whites/Caucasians | 99.9 /100 | #49 | Exceptional 1.6% |
| Celtics | 99.9 /100 | #50 | Exceptional 1.6% |
| Chippewa | 99.8 /100 | #51 | Exceptional 1.6% |
| Immigrants | Canada | 99.8 /100 | #52 | Exceptional 1.6% |
| Creek | 99.8 /100 | #53 | Exceptional 1.6% |
Demographics Similar to South American Indians by No Schooling Completed
In terms of no schooling completed, the demographic groups most similar to South American Indians are Uruguayan (2.2%, a difference of 0.0%), Bahamian (2.2%, a difference of 0.18%), Immigrants from Bahamas (2.2%, a difference of 0.19%), Immigrants from Oceania (2.2%, a difference of 0.26%), and Native/Alaskan (2.2%, a difference of 0.33%).
| Demographics | Rating | Rank | No Schooling Completed |
| Immigrants | Northern Africa | 19.5 /100 | #200 | Poor 2.2% |
| Costa Ricans | 17.1 /100 | #201 | Poor 2.2% |
| Moroccans | 13.7 /100 | #202 | Poor 2.2% |
| Laotians | 13.3 /100 | #203 | Poor 2.2% |
| Hopi | 12.9 /100 | #204 | Poor 2.2% |
| Immigrants | Bahamas | 11.6 /100 | #205 | Poor 2.2% |
| Bahamians | 11.6 /100 | #206 | Poor 2.2% |
| South American Indians | 11.0 /100 | #207 | Poor 2.2% |
| Uruguayans | 11.0 /100 | #208 | Poor 2.2% |
| Immigrants | Oceania | 10.2 /100 | #209 | Poor 2.2% |
| Natives/Alaskans | 10.0 /100 | #210 | Tragic 2.2% |
| Immigrants | Panama | 8.8 /100 | #211 | Tragic 2.3% |
| Immigrants | Morocco | 8.7 /100 | #212 | Tragic 2.3% |
| Ute | 8.2 /100 | #213 | Tragic 2.3% |
| Samoans | 8.2 /100 | #214 | Tragic 2.3% |