Maltese vs Pima 10th Grade
COMPARE
Maltese
Pima
10th Grade
10th Grade Comparison
Maltese
Pima
95.5%
10TH GRADE
100.0/ 100
METRIC RATING
25th/ 347
METRIC RANK
91.2%
10TH GRADE
0.0/ 100
METRIC RATING
304th/ 347
METRIC RANK
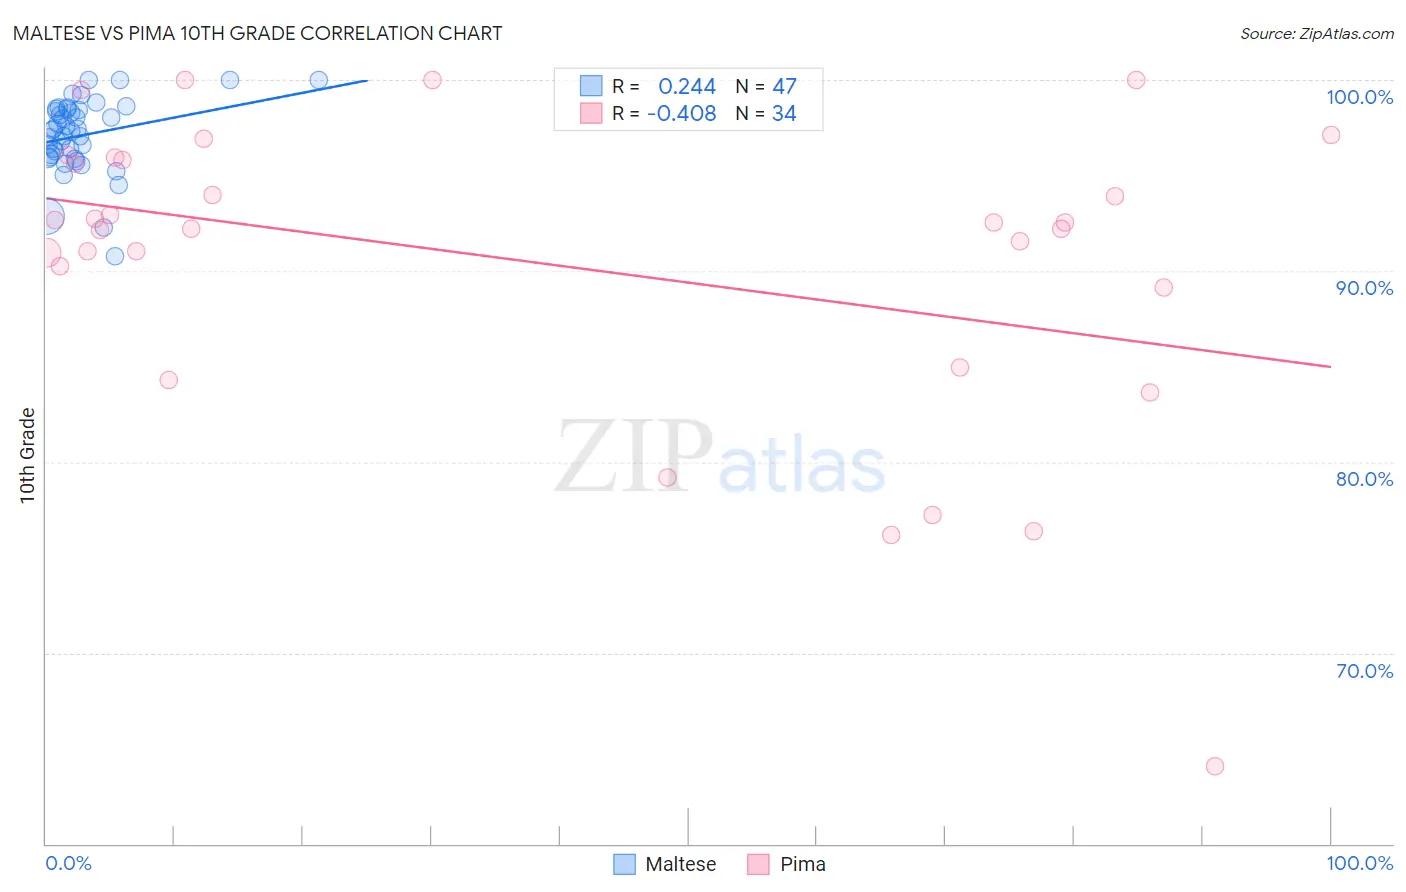
Maltese vs Pima 10th Grade Correlation Chart
The statistical analysis conducted on geographies consisting of 126,475,193 people shows a weak positive correlation between the proportion of Maltese and percentage of population with at least 10th grade education in the United States with a correlation coefficient (R) of 0.244 and weighted average of 95.5%. Similarly, the statistical analysis conducted on geographies consisting of 61,552,942 people shows a moderate negative correlation between the proportion of Pima and percentage of population with at least 10th grade education in the United States with a correlation coefficient (R) of -0.408 and weighted average of 91.2%, a difference of 4.7%.
10th Grade Correlation Summary
| Measurement | Maltese | Pima |
| Minimum | 90.8% | 64.0% |
| Maximum | 100.0% | 100.0% |
| Range | 9.2% | 36.0% |
| Mean | 97.1% | 90.4% |
| Median | 97.4% | 92.4% |
| Interquartile 25% (IQ1) | 96.0% | 89.1% |
| Interquartile 75% (IQ3) | 98.5% | 95.8% |
| Interquartile Range (IQR) | 2.6% | 6.7% |
| Standard Deviation (Sample) | 2.0% | 8.0% |
| Standard Deviation (Population) | 1.9% | 7.9% |
Similar Demographics by 10th Grade
Demographics Similar to Maltese by 10th Grade
In terms of 10th grade, the demographic groups most similar to Maltese are European (95.5%, a difference of 0.0%), Czech (95.5%, a difference of 0.020%), Welsh (95.5%, a difference of 0.020%), Eastern European (95.5%, a difference of 0.030%), and Alaskan Athabascan (95.4%, a difference of 0.040%).
| Demographics | Rating | Rank | 10th Grade |
| Italians | 100.0 /100 | #18 | Exceptional 95.6% |
| Scandinavians | 100.0 /100 | #19 | Exceptional 95.6% |
| Chinese | 100.0 /100 | #20 | Exceptional 95.5% |
| Dutch | 100.0 /100 | #21 | Exceptional 95.5% |
| Eastern Europeans | 100.0 /100 | #22 | Exceptional 95.5% |
| Czechs | 100.0 /100 | #23 | Exceptional 95.5% |
| Europeans | 100.0 /100 | #24 | Exceptional 95.5% |
| Maltese | 100.0 /100 | #25 | Exceptional 95.5% |
| Welsh | 100.0 /100 | #26 | Exceptional 95.5% |
| Alaskan Athabascans | 100.0 /100 | #27 | Exceptional 95.4% |
| Luxembourgers | 100.0 /100 | #28 | Exceptional 95.4% |
| Bulgarians | 100.0 /100 | #29 | Exceptional 95.4% |
| Belgians | 100.0 /100 | #30 | Exceptional 95.4% |
| Iranians | 100.0 /100 | #31 | Exceptional 95.3% |
| Hungarians | 100.0 /100 | #32 | Exceptional 95.3% |
Demographics Similar to Pima by 10th Grade
In terms of 10th grade, the demographic groups most similar to Pima are Immigrants from Dominica (91.1%, a difference of 0.020%), Immigrants from Vietnam (91.2%, a difference of 0.060%), Japanese (91.2%, a difference of 0.080%), Immigrants from Guyana (91.2%, a difference of 0.080%), and Yaqui (91.1%, a difference of 0.080%).
| Demographics | Rating | Rank | 10th Grade |
| Fijians | 0.0 /100 | #297 | Tragic 91.5% |
| Cubans | 0.0 /100 | #298 | Tragic 91.5% |
| Immigrants | Haiti | 0.0 /100 | #299 | Tragic 91.4% |
| Guyanese | 0.0 /100 | #300 | Tragic 91.4% |
| Japanese | 0.0 /100 | #301 | Tragic 91.2% |
| Immigrants | Guyana | 0.0 /100 | #302 | Tragic 91.2% |
| Immigrants | Vietnam | 0.0 /100 | #303 | Tragic 91.2% |
| Pima | 0.0 /100 | #304 | Tragic 91.2% |
| Immigrants | Dominica | 0.0 /100 | #305 | Tragic 91.1% |
| Yaqui | 0.0 /100 | #306 | Tragic 91.1% |
| Immigrants | Fiji | 0.0 /100 | #307 | Tragic 91.0% |
| Immigrants | Bangladesh | 0.0 /100 | #308 | Tragic 91.0% |
| Immigrants | Immigrants | 0.0 /100 | #309 | Tragic 91.0% |
| Vietnamese | 0.0 /100 | #310 | Tragic 90.9% |
| Immigrants | Cambodia | 0.0 /100 | #311 | Tragic 90.9% |