Maltese vs Immigrants from Honduras Professional Degree
COMPARE
Maltese
Immigrants from Honduras
Professional Degree
Professional Degree Comparison
Maltese
Immigrants from Honduras
5.0%
PROFESSIONAL DEGREE
98.1/ 100
METRIC RATING
107th/ 347
METRIC RANK
3.5%
PROFESSIONAL DEGREE
0.3/ 100
METRIC RATING
293rd/ 347
METRIC RANK
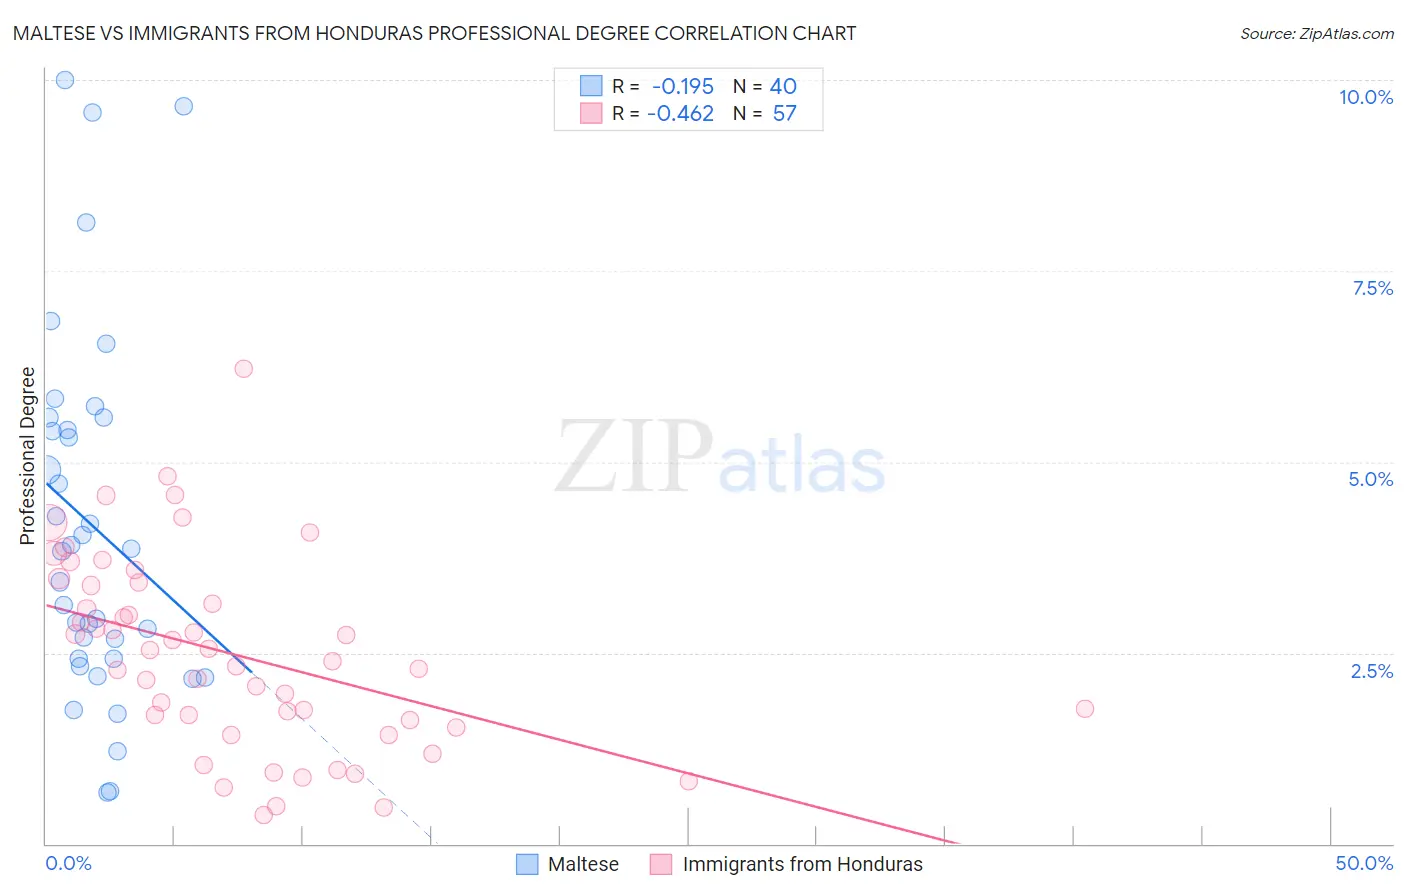
Maltese vs Immigrants from Honduras Professional Degree Correlation Chart
The statistical analysis conducted on geographies consisting of 126,398,771 people shows a poor negative correlation between the proportion of Maltese and percentage of population with at least professional degree education in the United States with a correlation coefficient (R) of -0.195 and weighted average of 5.0%. Similarly, the statistical analysis conducted on geographies consisting of 321,705,777 people shows a moderate negative correlation between the proportion of Immigrants from Honduras and percentage of population with at least professional degree education in the United States with a correlation coefficient (R) of -0.462 and weighted average of 3.5%, a difference of 45.9%.
Professional Degree Correlation Summary
| Measurement | Maltese | Immigrants from Honduras |
| Minimum | 0.68% | 0.38% |
| Maximum | 10.0% | 6.2% |
| Range | 9.3% | 5.8% |
| Mean | 4.2% | 2.5% |
| Median | 3.9% | 2.4% |
| Interquartile 25% (IQ1) | 2.4% | 1.6% |
| Interquartile 75% (IQ3) | 5.5% | 3.4% |
| Interquartile Range (IQR) | 3.1% | 1.8% |
| Standard Deviation (Sample) | 2.4% | 1.3% |
| Standard Deviation (Population) | 2.3% | 1.2% |
Similar Demographics by Professional Degree
Demographics Similar to Maltese by Professional Degree
In terms of professional degree, the demographic groups most similar to Maltese are Immigrants from Southern Europe (5.0%, a difference of 0.040%), British (5.0%, a difference of 0.060%), Immigrants from Ukraine (5.0%, a difference of 0.12%), Immigrants from Uganda (5.0%, a difference of 0.15%), and Arab (5.0%, a difference of 0.17%).
| Demographics | Rating | Rank | Professional Degree |
| Ugandans | 98.8 /100 | #100 | Exceptional 5.1% |
| Immigrants | Egypt | 98.5 /100 | #101 | Exceptional 5.1% |
| Ukrainians | 98.5 /100 | #102 | Exceptional 5.1% |
| Immigrants | Northern Africa | 98.4 /100 | #103 | Exceptional 5.1% |
| Arabs | 98.2 /100 | #104 | Exceptional 5.0% |
| Immigrants | Uganda | 98.2 /100 | #105 | Exceptional 5.0% |
| Immigrants | Ukraine | 98.2 /100 | #106 | Exceptional 5.0% |
| Maltese | 98.1 /100 | #107 | Exceptional 5.0% |
| Immigrants | Southern Europe | 98.1 /100 | #108 | Exceptional 5.0% |
| British | 98.0 /100 | #109 | Exceptional 5.0% |
| Lebanese | 98.0 /100 | #110 | Exceptional 5.0% |
| Brazilians | 97.4 /100 | #111 | Exceptional 5.0% |
| Taiwanese | 97.3 /100 | #112 | Exceptional 5.0% |
| Immigrants | Pakistan | 97.2 /100 | #113 | Exceptional 5.0% |
| Immigrants | Morocco | 96.8 /100 | #114 | Exceptional 5.0% |
Demographics Similar to Immigrants from Honduras by Professional Degree
In terms of professional degree, the demographic groups most similar to Immigrants from Honduras are Paiute (3.4%, a difference of 0.080%), Immigrants from Belize (3.5%, a difference of 0.24%), Immigrants from Guatemala (3.4%, a difference of 0.24%), Hawaiian (3.4%, a difference of 0.25%), and Alaska Native (3.5%, a difference of 0.30%).
| Demographics | Rating | Rank | Professional Degree |
| Haitians | 0.3 /100 | #286 | Tragic 3.5% |
| Immigrants | El Salvador | 0.3 /100 | #287 | Tragic 3.5% |
| Blackfeet | 0.3 /100 | #288 | Tragic 3.5% |
| Guatemalans | 0.3 /100 | #289 | Tragic 3.5% |
| Chippewa | 0.3 /100 | #290 | Tragic 3.5% |
| Alaska Natives | 0.3 /100 | #291 | Tragic 3.5% |
| Immigrants | Belize | 0.3 /100 | #292 | Tragic 3.5% |
| Immigrants | Honduras | 0.3 /100 | #293 | Tragic 3.5% |
| Paiute | 0.3 /100 | #294 | Tragic 3.4% |
| Immigrants | Guatemala | 0.2 /100 | #295 | Tragic 3.4% |
| Hawaiians | 0.2 /100 | #296 | Tragic 3.4% |
| Immigrants | Liberia | 0.2 /100 | #297 | Tragic 3.4% |
| Ottawa | 0.2 /100 | #298 | Tragic 3.4% |
| Immigrants | Yemen | 0.2 /100 | #299 | Tragic 3.4% |
| Blacks/African Americans | 0.2 /100 | #300 | Tragic 3.4% |