Maltese vs Immigrants from Eastern Africa 11th Grade
COMPARE
Maltese
Immigrants from Eastern Africa
11th Grade
11th Grade Comparison
Maltese
Immigrants from Eastern Africa
94.5%
11TH GRADE
100.0/ 100
METRIC RATING
18th/ 347
METRIC RANK
92.3%
11TH GRADE
24.1/ 100
METRIC RATING
202nd/ 347
METRIC RANK
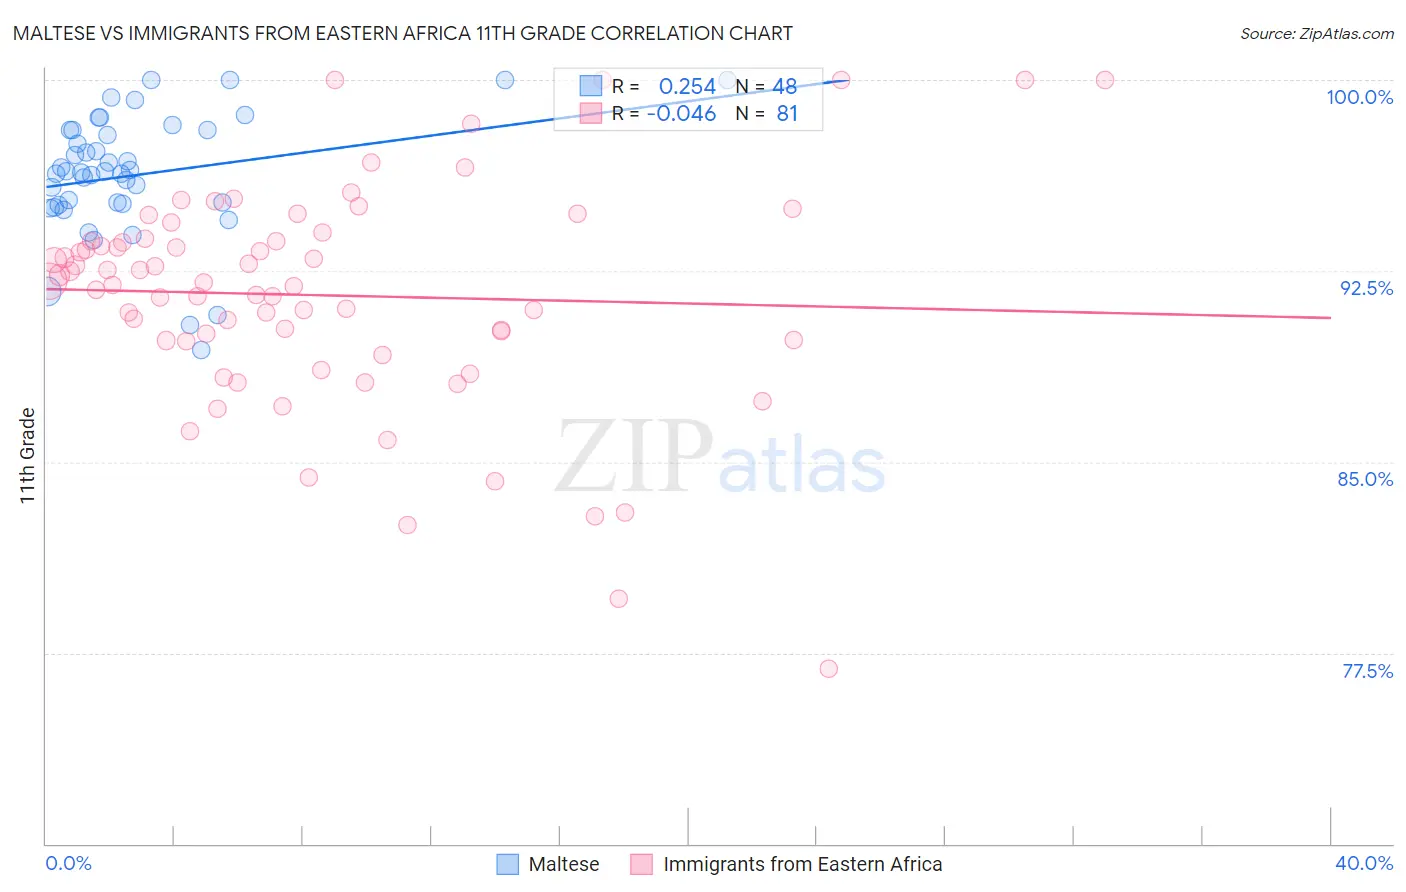
Maltese vs Immigrants from Eastern Africa 11th Grade Correlation Chart
The statistical analysis conducted on geographies consisting of 126,478,070 people shows a weak positive correlation between the proportion of Maltese and percentage of population with at least 11th grade education in the United States with a correlation coefficient (R) of 0.254 and weighted average of 94.5%. Similarly, the statistical analysis conducted on geographies consisting of 355,144,184 people shows no correlation between the proportion of Immigrants from Eastern Africa and percentage of population with at least 11th grade education in the United States with a correlation coefficient (R) of -0.046 and weighted average of 92.3%, a difference of 2.4%.
11th Grade Correlation Summary
| Measurement | Maltese | Immigrants from Eastern Africa |
| Minimum | 89.4% | 76.9% |
| Maximum | 100.0% | 100.0% |
| Range | 10.6% | 23.1% |
| Mean | 96.3% | 91.5% |
| Median | 96.4% | 92.1% |
| Interquartile 25% (IQ1) | 95.1% | 89.7% |
| Interquartile 75% (IQ3) | 98.0% | 93.7% |
| Interquartile Range (IQR) | 2.9% | 4.0% |
| Standard Deviation (Sample) | 2.4% | 4.4% |
| Standard Deviation (Population) | 2.4% | 4.4% |
Similar Demographics by 11th Grade
Demographics Similar to Maltese by 11th Grade
In terms of 11th grade, the demographic groups most similar to Maltese are Luxembourger (94.5%, a difference of 0.0%), Scandinavian (94.5%, a difference of 0.0%), Bulgarian (94.5%, a difference of 0.010%), Immigrants from India (94.5%, a difference of 0.010%), and Italian (94.5%, a difference of 0.030%).
| Demographics | Rating | Rank | 11th Grade |
| Germans | 100.0 /100 | #11 | Exceptional 94.7% |
| Latvians | 100.0 /100 | #12 | Exceptional 94.7% |
| Chinese | 100.0 /100 | #13 | Exceptional 94.6% |
| Eastern Europeans | 100.0 /100 | #14 | Exceptional 94.6% |
| Bulgarians | 100.0 /100 | #15 | Exceptional 94.5% |
| Immigrants | India | 100.0 /100 | #16 | Exceptional 94.5% |
| Luxembourgers | 100.0 /100 | #17 | Exceptional 94.5% |
| Maltese | 100.0 /100 | #18 | Exceptional 94.5% |
| Scandinavians | 100.0 /100 | #19 | Exceptional 94.5% |
| Italians | 100.0 /100 | #20 | Exceptional 94.5% |
| Tlingit-Haida | 100.0 /100 | #21 | Exceptional 94.4% |
| Tsimshian | 100.0 /100 | #22 | Exceptional 94.4% |
| Czechs | 100.0 /100 | #23 | Exceptional 94.4% |
| English | 100.0 /100 | #24 | Exceptional 94.4% |
| Irish | 100.0 /100 | #25 | Exceptional 94.4% |
Demographics Similar to Immigrants from Eastern Africa by 11th Grade
In terms of 11th grade, the demographic groups most similar to Immigrants from Eastern Africa are Samoan (92.3%, a difference of 0.010%), Immigrants from China (92.3%, a difference of 0.010%), Immigrants from Sudan (92.3%, a difference of 0.010%), Immigrants from Hong Kong (92.2%, a difference of 0.010%), and Kiowa (92.2%, a difference of 0.010%).
| Demographics | Rating | Rank | 11th Grade |
| Liberians | 26.8 /100 | #195 | Fair 92.3% |
| Panamanians | 26.4 /100 | #196 | Fair 92.3% |
| Marshallese | 26.0 /100 | #197 | Fair 92.3% |
| Hawaiians | 25.5 /100 | #198 | Fair 92.3% |
| Immigrants | Uganda | 25.2 /100 | #199 | Fair 92.3% |
| Samoans | 25.1 /100 | #200 | Fair 92.3% |
| Immigrants | China | 25.1 /100 | #201 | Fair 92.3% |
| Immigrants | Eastern Africa | 24.1 /100 | #202 | Fair 92.3% |
| Immigrants | Sudan | 23.5 /100 | #203 | Fair 92.3% |
| Immigrants | Hong Kong | 23.3 /100 | #204 | Fair 92.2% |
| Kiowa | 23.2 /100 | #205 | Fair 92.2% |
| Bolivians | 23.2 /100 | #206 | Fair 92.2% |
| Immigrants | Oceania | 22.4 /100 | #207 | Fair 92.2% |
| Colville | 21.8 /100 | #208 | Fair 92.2% |
| Tongans | 19.8 /100 | #209 | Poor 92.2% |