Malaysian vs Paraguayan Doctorate Degree
COMPARE
Malaysian
Paraguayan
Doctorate Degree
Doctorate Degree Comparison
Malaysians
Paraguayans
1.5%
DOCTORATE DEGREE
0.3/ 100
METRIC RATING
285th/ 347
METRIC RANK
2.3%
DOCTORATE DEGREE
99.9/ 100
METRIC RATING
65th/ 347
METRIC RANK
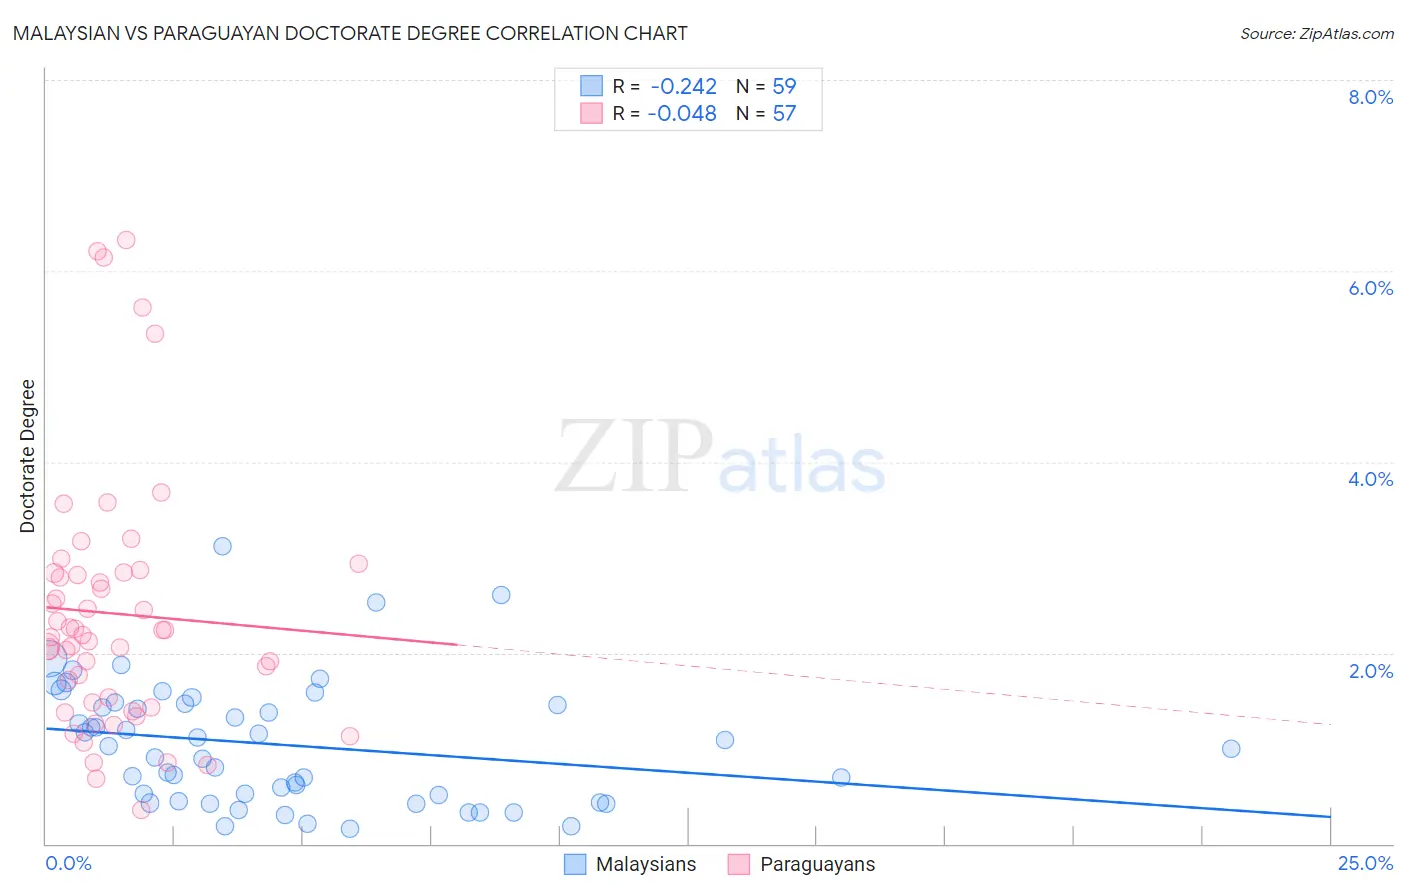
Malaysian vs Paraguayan Doctorate Degree Correlation Chart
The statistical analysis conducted on geographies consisting of 224,756,978 people shows a weak negative correlation between the proportion of Malaysians and percentage of population with at least doctorate degree education in the United States with a correlation coefficient (R) of -0.242 and weighted average of 1.5%. Similarly, the statistical analysis conducted on geographies consisting of 94,964,033 people shows no correlation between the proportion of Paraguayans and percentage of population with at least doctorate degree education in the United States with a correlation coefficient (R) of -0.048 and weighted average of 2.3%, a difference of 57.1%.
Doctorate Degree Correlation Summary
| Measurement | Malaysian | Paraguayan |
| Minimum | 0.16% | 0.35% |
| Maximum | 3.1% | 6.3% |
| Range | 3.0% | 6.0% |
| Mean | 1.0% | 2.4% |
| Median | 1.00% | 2.2% |
| Interquartile 25% (IQ1) | 0.45% | 1.5% |
| Interquartile 75% (IQ3) | 1.5% | 2.8% |
| Interquartile Range (IQR) | 1.0% | 1.4% |
| Standard Deviation (Sample) | 0.65% | 1.3% |
| Standard Deviation (Population) | 0.64% | 1.3% |
Similar Demographics by Doctorate Degree
Demographics Similar to Malaysians by Doctorate Degree
In terms of doctorate degree, the demographic groups most similar to Malaysians are Jamaican (1.5%, a difference of 0.030%), Central American (1.5%, a difference of 0.070%), British West Indian (1.5%, a difference of 0.11%), Tohono O'odham (1.5%, a difference of 0.17%), and Cherokee (1.5%, a difference of 0.18%).
| Demographics | Rating | Rank | Doctorate Degree |
| Hawaiians | 0.4 /100 | #278 | Tragic 1.5% |
| Marshallese | 0.4 /100 | #279 | Tragic 1.5% |
| Ecuadorians | 0.4 /100 | #280 | Tragic 1.5% |
| Tohono O'odham | 0.4 /100 | #281 | Tragic 1.5% |
| British West Indians | 0.3 /100 | #282 | Tragic 1.5% |
| Central Americans | 0.3 /100 | #283 | Tragic 1.5% |
| Jamaicans | 0.3 /100 | #284 | Tragic 1.5% |
| Malaysians | 0.3 /100 | #285 | Tragic 1.5% |
| Cherokee | 0.3 /100 | #286 | Tragic 1.5% |
| Cajuns | 0.3 /100 | #287 | Tragic 1.5% |
| Immigrants | El Salvador | 0.3 /100 | #288 | Tragic 1.4% |
| Cape Verdeans | 0.3 /100 | #289 | Tragic 1.4% |
| Choctaw | 0.3 /100 | #290 | Tragic 1.4% |
| Blacks/African Americans | 0.3 /100 | #291 | Tragic 1.4% |
| Alaska Natives | 0.3 /100 | #292 | Tragic 1.4% |
Demographics Similar to Paraguayans by Doctorate Degree
In terms of doctorate degree, the demographic groups most similar to Paraguayans are Argentinean (2.3%, a difference of 0.17%), Immigrants from Greece (2.3%, a difference of 0.50%), Zimbabwean (2.3%, a difference of 0.63%), Immigrants from Kazakhstan (2.3%, a difference of 0.86%), and Laotian (2.3%, a difference of 0.90%).
| Demographics | Rating | Rank | Doctorate Degree |
| Ethiopians | 99.9 /100 | #58 | Exceptional 2.3% |
| South Africans | 99.9 /100 | #59 | Exceptional 2.3% |
| Immigrants | Serbia | 99.9 /100 | #60 | Exceptional 2.3% |
| Bhutanese | 99.9 /100 | #61 | Exceptional 2.3% |
| Immigrants | Europe | 99.9 /100 | #62 | Exceptional 2.3% |
| Laotians | 99.9 /100 | #63 | Exceptional 2.3% |
| Immigrants | Greece | 99.9 /100 | #64 | Exceptional 2.3% |
| Paraguayans | 99.9 /100 | #65 | Exceptional 2.3% |
| Argentineans | 99.9 /100 | #66 | Exceptional 2.3% |
| Zimbabweans | 99.8 /100 | #67 | Exceptional 2.3% |
| Immigrants | Kazakhstan | 99.8 /100 | #68 | Exceptional 2.3% |
| Carpatho Rusyns | 99.8 /100 | #69 | Exceptional 2.3% |
| Lithuanians | 99.8 /100 | #70 | Exceptional 2.3% |
| Immigrants | Bolivia | 99.8 /100 | #71 | Exceptional 2.3% |
| Immigrants | Canada | 99.8 /100 | #72 | Exceptional 2.3% |