Malaysian vs Immigrants from Syria 1st Grade
COMPARE
Malaysian
Immigrants from Syria
1st Grade
1st Grade Comparison
Malaysians
Immigrants from Syria
97.2%
1ST GRADE
0.0/ 100
METRIC RATING
293rd/ 347
METRIC RANK
97.7%
1ST GRADE
4.2/ 100
METRIC RATING
222nd/ 347
METRIC RANK
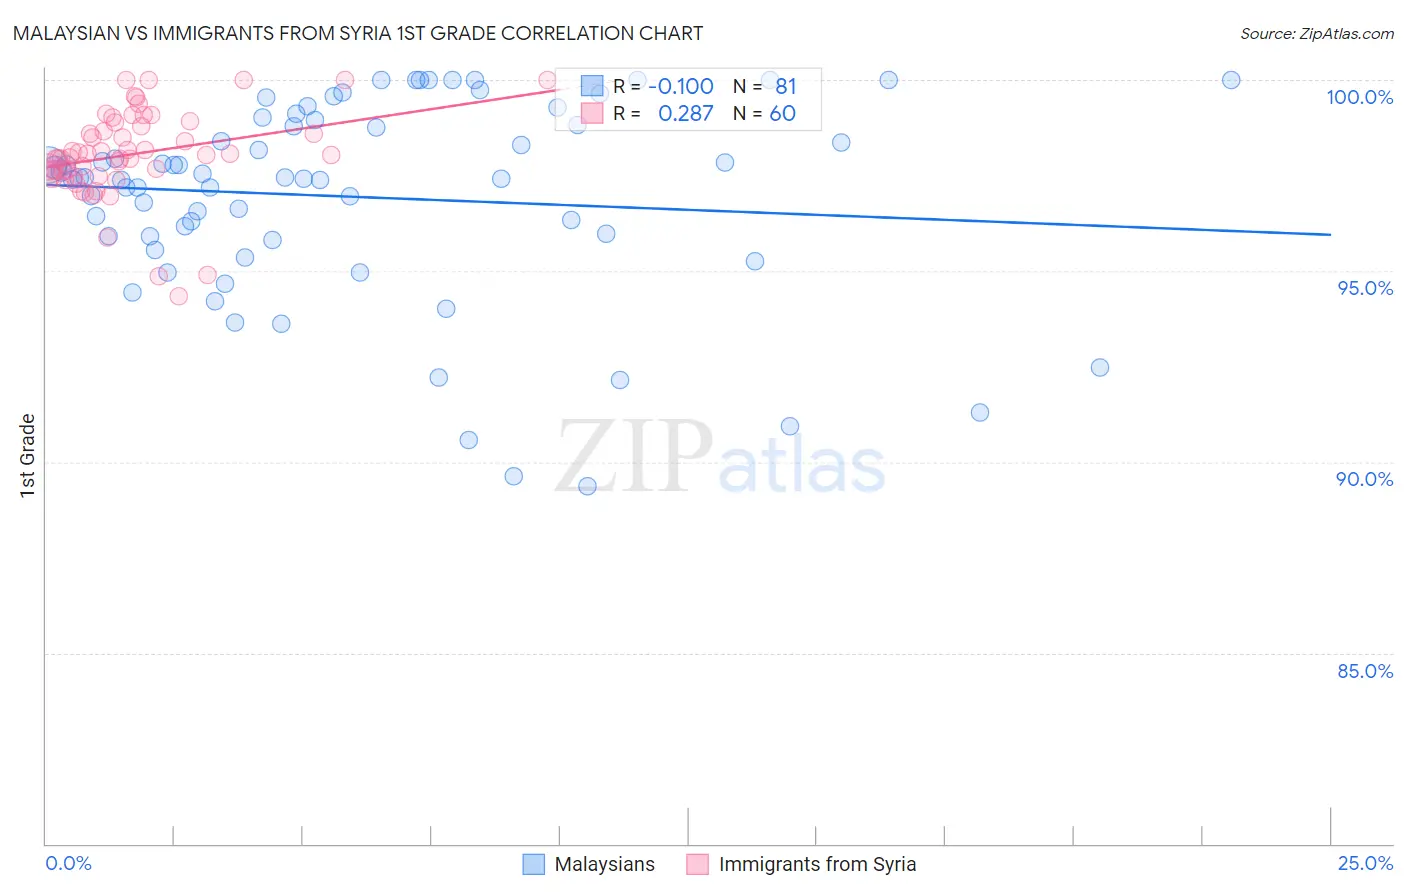
Malaysian vs Immigrants from Syria 1st Grade Correlation Chart
The statistical analysis conducted on geographies consisting of 226,107,000 people shows a slight negative correlation between the proportion of Malaysians and percentage of population with at least 1st grade education in the United States with a correlation coefficient (R) of -0.100 and weighted average of 97.2%. Similarly, the statistical analysis conducted on geographies consisting of 174,108,374 people shows a weak positive correlation between the proportion of Immigrants from Syria and percentage of population with at least 1st grade education in the United States with a correlation coefficient (R) of 0.287 and weighted average of 97.7%, a difference of 0.50%.
1st Grade Correlation Summary
| Measurement | Malaysian | Immigrants from Syria |
| Minimum | 89.4% | 94.3% |
| Maximum | 100.0% | 100.0% |
| Range | 10.6% | 5.7% |
| Mean | 96.9% | 98.1% |
| Median | 97.4% | 98.0% |
| Interquartile 25% (IQ1) | 95.9% | 97.5% |
| Interquartile 75% (IQ3) | 98.9% | 98.8% |
| Interquartile Range (IQR) | 3.0% | 1.3% |
| Standard Deviation (Sample) | 2.6% | 1.2% |
| Standard Deviation (Population) | 2.6% | 1.2% |
Similar Demographics by 1st Grade
Demographics Similar to Malaysians by 1st Grade
In terms of 1st grade, the demographic groups most similar to Malaysians are British West Indian (97.2%, a difference of 0.020%), Immigrants from Grenada (97.2%, a difference of 0.020%), Immigrants (97.2%, a difference of 0.030%), Immigrants from Eritrea (97.2%, a difference of 0.030%), and Houma (97.2%, a difference of 0.040%).
| Demographics | Rating | Rank | 1st Grade |
| Immigrants | Barbados | 0.0 /100 | #286 | Tragic 97.3% |
| Immigrants | Hong Kong | 0.0 /100 | #287 | Tragic 97.3% |
| Immigrants | Thailand | 0.0 /100 | #288 | Tragic 97.3% |
| Immigrants | Afghanistan | 0.0 /100 | #289 | Tragic 97.3% |
| Immigrants | St. Vincent and the Grenadines | 0.0 /100 | #290 | Tragic 97.3% |
| Houma | 0.0 /100 | #291 | Tragic 97.2% |
| British West Indians | 0.0 /100 | #292 | Tragic 97.2% |
| Malaysians | 0.0 /100 | #293 | Tragic 97.2% |
| Immigrants | Grenada | 0.0 /100 | #294 | Tragic 97.2% |
| Immigrants | Immigrants | 0.0 /100 | #295 | Tragic 97.2% |
| Immigrants | Eritrea | 0.0 /100 | #296 | Tragic 97.2% |
| Central American Indians | 0.0 /100 | #297 | Tragic 97.1% |
| Immigrants | Dominica | 0.0 /100 | #298 | Tragic 97.1% |
| Immigrants | Cuba | 0.0 /100 | #299 | Tragic 97.1% |
| Haitians | 0.0 /100 | #300 | Tragic 97.1% |
Demographics Similar to Immigrants from Syria by 1st Grade
In terms of 1st grade, the demographic groups most similar to Immigrants from Syria are Immigrants from Sudan (97.7%, a difference of 0.0%), Immigrants from Zaire (97.7%, a difference of 0.0%), Iraqi (97.7%, a difference of 0.0%), Immigrants from Nepal (97.7%, a difference of 0.0%), and Tongan (97.7%, a difference of 0.010%).
| Demographics | Rating | Rank | 1st Grade |
| Bahamians | 7.5 /100 | #215 | Tragic 97.7% |
| Uruguayans | 7.4 /100 | #216 | Tragic 97.7% |
| Samoans | 6.8 /100 | #217 | Tragic 97.7% |
| Immigrants | Morocco | 5.3 /100 | #218 | Tragic 97.7% |
| Immigrants | Panama | 5.2 /100 | #219 | Tragic 97.7% |
| Tongans | 4.6 /100 | #220 | Tragic 97.7% |
| Immigrants | Sudan | 4.3 /100 | #221 | Tragic 97.7% |
| Immigrants | Syria | 4.2 /100 | #222 | Tragic 97.7% |
| Immigrants | Zaire | 4.1 /100 | #223 | Tragic 97.7% |
| Iraqis | 4.0 /100 | #224 | Tragic 97.7% |
| Immigrants | Nepal | 4.0 /100 | #225 | Tragic 97.7% |
| Sudanese | 3.7 /100 | #226 | Tragic 97.7% |
| Sierra Leoneans | 3.6 /100 | #227 | Tragic 97.7% |
| Sub-Saharan Africans | 3.6 /100 | #228 | Tragic 97.7% |
| Immigrants | Costa Rica | 3.5 /100 | #229 | Tragic 97.7% |