Malaysian vs Immigrants from Moldova Professional Degree
COMPARE
Malaysian
Immigrants from Moldova
Professional Degree
Professional Degree Comparison
Malaysians
Immigrants from Moldova
3.4%
PROFESSIONAL DEGREE
0.2/ 100
METRIC RATING
302nd/ 347
METRIC RANK
4.9%
PROFESSIONAL DEGREE
94.8/ 100
METRIC RATING
121st/ 347
METRIC RANK
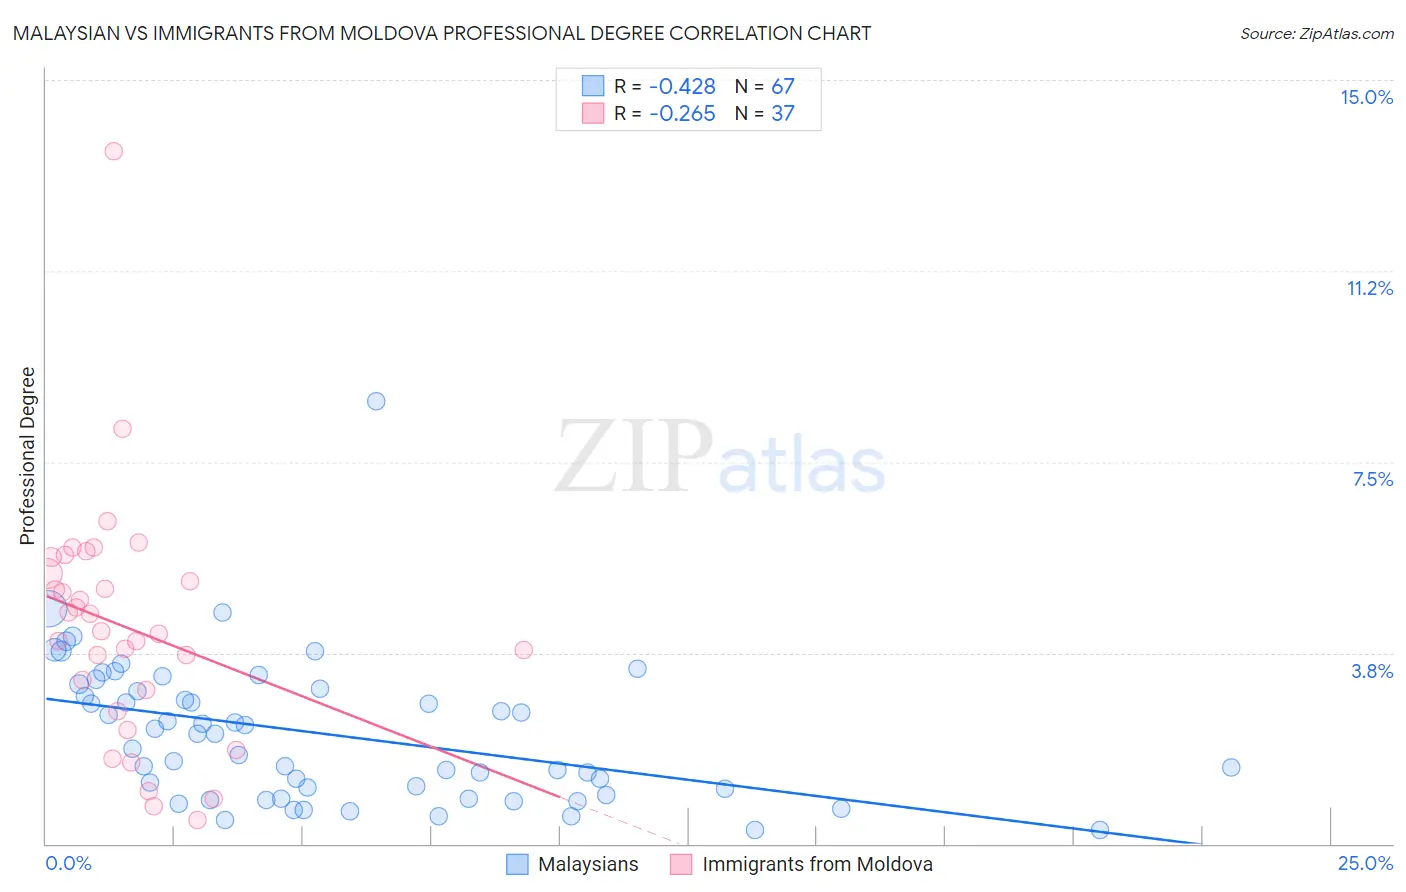
Malaysian vs Immigrants from Moldova Professional Degree Correlation Chart
The statistical analysis conducted on geographies consisting of 225,764,269 people shows a moderate negative correlation between the proportion of Malaysians and percentage of population with at least professional degree education in the United States with a correlation coefficient (R) of -0.428 and weighted average of 3.4%. Similarly, the statistical analysis conducted on geographies consisting of 124,337,930 people shows a weak negative correlation between the proportion of Immigrants from Moldova and percentage of population with at least professional degree education in the United States with a correlation coefficient (R) of -0.265 and weighted average of 4.9%, a difference of 43.6%.
Professional Degree Correlation Summary
| Measurement | Malaysian | Immigrants from Moldova |
| Minimum | 0.26% | 0.45% |
| Maximum | 8.7% | 13.6% |
| Range | 8.4% | 13.1% |
| Mean | 2.2% | 4.2% |
| Median | 2.1% | 4.2% |
| Interquartile 25% (IQ1) | 0.97% | 2.8% |
| Interquartile 75% (IQ3) | 3.1% | 5.5% |
| Interquartile Range (IQR) | 2.1% | 2.7% |
| Standard Deviation (Sample) | 1.4% | 2.4% |
| Standard Deviation (Population) | 1.4% | 2.3% |
Similar Demographics by Professional Degree
Demographics Similar to Malaysians by Professional Degree
In terms of professional degree, the demographic groups most similar to Malaysians are Immigrants from Dominican Republic (3.4%, a difference of 0.11%), Black/African American (3.4%, a difference of 0.25%), Immigrants from Yemen (3.4%, a difference of 0.38%), Immigrants from Haiti (3.4%, a difference of 0.66%), and Cajun (3.4%, a difference of 0.66%).
| Demographics | Rating | Rank | Professional Degree |
| Immigrants | Guatemala | 0.2 /100 | #295 | Tragic 3.4% |
| Hawaiians | 0.2 /100 | #296 | Tragic 3.4% |
| Immigrants | Liberia | 0.2 /100 | #297 | Tragic 3.4% |
| Ottawa | 0.2 /100 | #298 | Tragic 3.4% |
| Immigrants | Yemen | 0.2 /100 | #299 | Tragic 3.4% |
| Blacks/African Americans | 0.2 /100 | #300 | Tragic 3.4% |
| Immigrants | Dominican Republic | 0.2 /100 | #301 | Tragic 3.4% |
| Malaysians | 0.2 /100 | #302 | Tragic 3.4% |
| Immigrants | Haiti | 0.2 /100 | #303 | Tragic 3.4% |
| Cajuns | 0.2 /100 | #304 | Tragic 3.4% |
| Chickasaw | 0.1 /100 | #305 | Tragic 3.4% |
| Cape Verdeans | 0.1 /100 | #306 | Tragic 3.4% |
| Samoans | 0.1 /100 | #307 | Tragic 3.3% |
| Shoshone | 0.1 /100 | #308 | Tragic 3.3% |
| Pima | 0.1 /100 | #309 | Tragic 3.3% |
Demographics Similar to Immigrants from Moldova by Professional Degree
In terms of professional degree, the demographic groups most similar to Immigrants from Moldova are Albanian (4.9%, a difference of 0.35%), Immigrants from Sudan (4.9%, a difference of 0.36%), Immigrants from Germany (4.9%, a difference of 0.46%), Immigrants from Venezuela (4.8%, a difference of 0.63%), and Immigrants from Eritrea (4.8%, a difference of 0.82%).
| Demographics | Rating | Rank | Professional Degree |
| Immigrants | Morocco | 96.8 /100 | #114 | Exceptional 5.0% |
| Moroccans | 96.8 /100 | #115 | Exceptional 5.0% |
| Venezuelans | 96.3 /100 | #116 | Exceptional 4.9% |
| Immigrants | Syria | 96.0 /100 | #117 | Exceptional 4.9% |
| Croatians | 96.0 /100 | #118 | Exceptional 4.9% |
| Immigrants | Sudan | 95.4 /100 | #119 | Exceptional 4.9% |
| Albanians | 95.3 /100 | #120 | Exceptional 4.9% |
| Immigrants | Moldova | 94.8 /100 | #121 | Exceptional 4.9% |
| Immigrants | Germany | 94.1 /100 | #122 | Exceptional 4.9% |
| Immigrants | Venezuela | 93.8 /100 | #123 | Exceptional 4.8% |
| Immigrants | Eritrea | 93.5 /100 | #124 | Exceptional 4.8% |
| Immigrants | Albania | 93.3 /100 | #125 | Exceptional 4.8% |
| Europeans | 93.2 /100 | #126 | Exceptional 4.8% |
| Serbians | 92.6 /100 | #127 | Exceptional 4.8% |
| Immigrants | Eastern Africa | 92.5 /100 | #128 | Exceptional 4.8% |