Macedonian vs Native/Alaskan Bachelor's Degree
COMPARE
Macedonian
Native/Alaskan
Bachelor's Degree
Bachelor's Degree Comparison
Macedonians
Natives/Alaskans
41.4%
BACHELOR'S DEGREE
98.1/ 100
METRIC RATING
100th/ 347
METRIC RANK
26.3%
BACHELOR'S DEGREE
0.0/ 100
METRIC RATING
335th/ 347
METRIC RANK
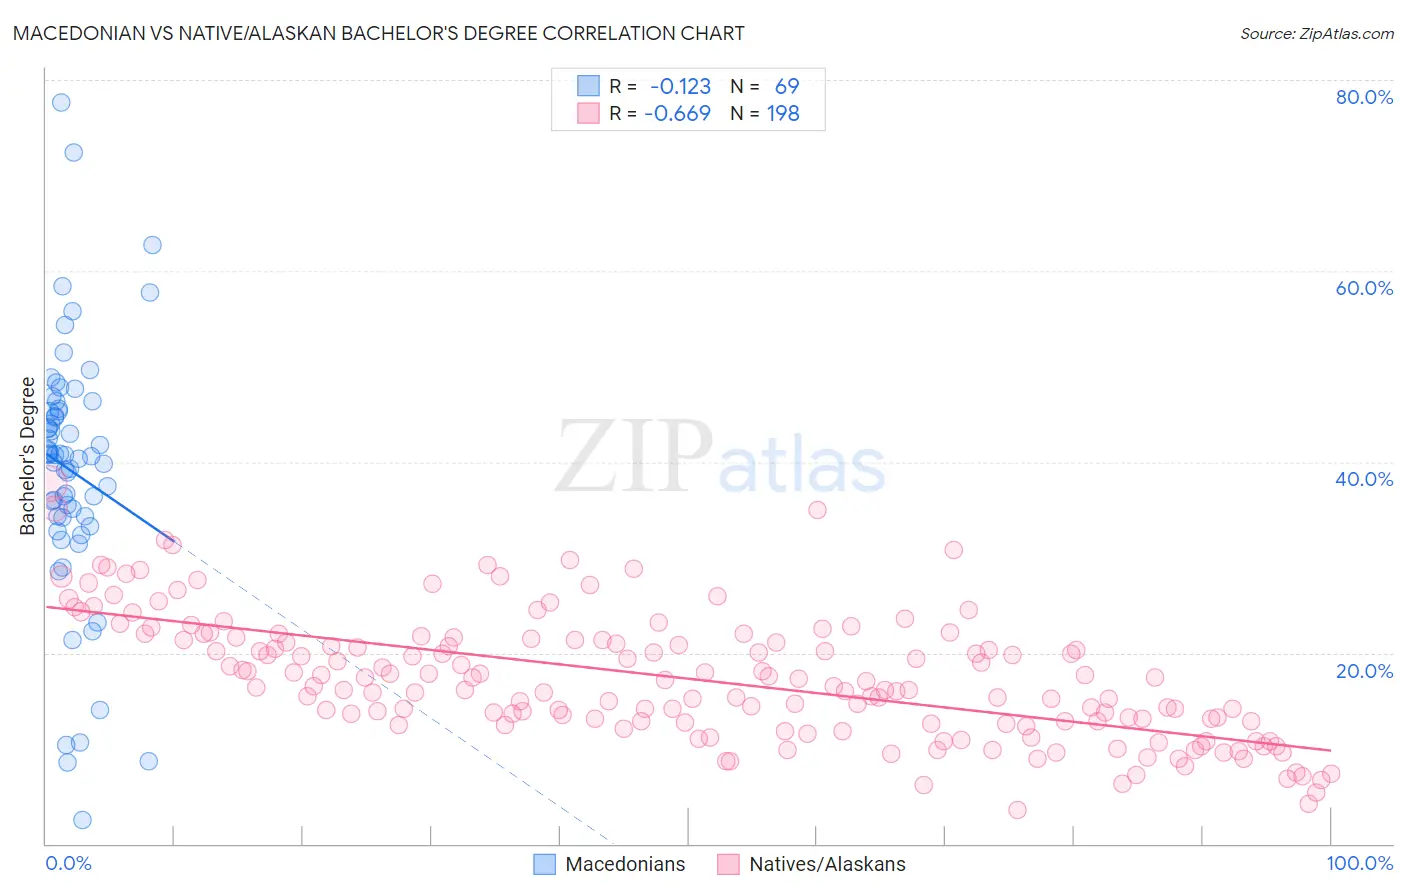
Macedonian vs Native/Alaskan Bachelor's Degree Correlation Chart
The statistical analysis conducted on geographies consisting of 132,656,802 people shows a poor negative correlation between the proportion of Macedonians and percentage of population with at least bachelor's degree education in the United States with a correlation coefficient (R) of -0.123 and weighted average of 41.4%. Similarly, the statistical analysis conducted on geographies consisting of 512,966,883 people shows a significant negative correlation between the proportion of Natives/Alaskans and percentage of population with at least bachelor's degree education in the United States with a correlation coefficient (R) of -0.669 and weighted average of 26.3%, a difference of 57.4%.
Bachelor's Degree Correlation Summary
| Measurement | Macedonian | Native/Alaskan |
| Minimum | 2.5% | 3.5% |
| Maximum | 77.6% | 37.7% |
| Range | 75.1% | 34.2% |
| Mean | 39.1% | 17.3% |
| Median | 40.7% | 16.5% |
| Interquartile 25% (IQ1) | 34.2% | 12.7% |
| Interquartile 75% (IQ3) | 45.5% | 21.3% |
| Interquartile Range (IQR) | 11.3% | 8.6% |
| Standard Deviation (Sample) | 13.5% | 6.5% |
| Standard Deviation (Population) | 13.4% | 6.5% |
Similar Demographics by Bachelor's Degree
Demographics Similar to Macedonians by Bachelor's Degree
In terms of bachelor's degree, the demographic groups most similar to Macedonians are Immigrants from England (41.4%, a difference of 0.030%), Immigrants from Morocco (41.4%, a difference of 0.030%), Immigrants from Ukraine (41.5%, a difference of 0.26%), Immigrants from Italy (41.3%, a difference of 0.29%), and Romanian (41.6%, a difference of 0.37%).
| Demographics | Rating | Rank | Bachelor's Degree |
| Immigrants | Canada | 98.6 /100 | #93 | Exceptional 41.7% |
| Immigrants | Nepal | 98.6 /100 | #94 | Exceptional 41.7% |
| Immigrants | North America | 98.5 /100 | #95 | Exceptional 41.7% |
| Immigrants | Moldova | 98.4 /100 | #96 | Exceptional 41.6% |
| Romanians | 98.4 /100 | #97 | Exceptional 41.6% |
| Immigrants | Ukraine | 98.3 /100 | #98 | Exceptional 41.5% |
| Immigrants | England | 98.1 /100 | #99 | Exceptional 41.4% |
| Macedonians | 98.1 /100 | #100 | Exceptional 41.4% |
| Immigrants | Morocco | 98.0 /100 | #101 | Exceptional 41.4% |
| Immigrants | Italy | 97.8 /100 | #102 | Exceptional 41.3% |
| Chileans | 97.5 /100 | #103 | Exceptional 41.2% |
| Jordanians | 97.4 /100 | #104 | Exceptional 41.2% |
| Syrians | 97.4 /100 | #105 | Exceptional 41.1% |
| Alsatians | 97.0 /100 | #106 | Exceptional 41.0% |
| Northern Europeans | 96.8 /100 | #107 | Exceptional 41.0% |
Demographics Similar to Natives/Alaskans by Bachelor's Degree
In terms of bachelor's degree, the demographic groups most similar to Natives/Alaskans are Immigrants from Mexico (26.1%, a difference of 0.70%), Arapaho (26.6%, a difference of 1.1%), Inupiat (25.8%, a difference of 2.0%), Mexican (27.1%, a difference of 2.9%), and Pueblo (25.5%, a difference of 3.1%).
| Demographics | Rating | Rank | Bachelor's Degree |
| Crow | 0.0 /100 | #328 | Tragic 27.7% |
| Immigrants | Central America | 0.0 /100 | #329 | Tragic 27.5% |
| Spanish American Indians | 0.0 /100 | #330 | Tragic 27.5% |
| Immigrants | Azores | 0.0 /100 | #331 | Tragic 27.3% |
| Menominee | 0.0 /100 | #332 | Tragic 27.3% |
| Mexicans | 0.0 /100 | #333 | Tragic 27.1% |
| Arapaho | 0.0 /100 | #334 | Tragic 26.6% |
| Natives/Alaskans | 0.0 /100 | #335 | Tragic 26.3% |
| Immigrants | Mexico | 0.0 /100 | #336 | Tragic 26.1% |
| Inupiat | 0.0 /100 | #337 | Tragic 25.8% |
| Pueblo | 0.0 /100 | #338 | Tragic 25.5% |
| Hopi | 0.0 /100 | #339 | Tragic 25.3% |
| Lumbee | 0.0 /100 | #340 | Tragic 24.8% |
| Yuman | 0.0 /100 | #341 | Tragic 24.5% |
| Yakama | 0.0 /100 | #342 | Tragic 24.5% |