Macedonian vs Immigrants from Yemen 5th Grade

COMPARE

Macedonian
Race
Ancestry
AfghanAfricanAlaska NativeAlaskan AthabascanAlbanianAleutAlsatianAmericanApacheArabArapahoArgentineanArmenianAssyrian/Chaldean/SyriacAustralianAustrianBahamianBangladeshiBarbadianBasqueBelgianBelizeanBermudanBhutaneseBlackfeetBolivianBrazilianBritishBritish West IndianBulgarianBurmeseCajunCambodianCanadianCape VerdeanCarpatho RusynCelticCentral AmericanCentral American IndianCherokeeCheyenneChickasawChileanChineseChippewaChoctawColombianColvilleComancheCosta RicanCreeCreekCroatianCrowCubanCypriotCzechCzechoslovakianDanishDelawareDominicanDutchDutch West IndianEastern EuropeanEcuadorianEgyptianEnglishEstonianEthiopianEuropeanFijianFilipinoFinnishFrenchFrench American IndianFrench CanadianGermanGerman RussianGhanaianGreekGuamanian/ChamorroGuatemalanGuyaneseHaitianHmongHonduranHopiHoumaHungarianIcelanderIndian (Asian)IndonesianInupiatIranianIraqiIrishIroquoisIsraeliItalianJamaicanJapaneseJordanianKenyanKiowaKoreanLaotianLatvianLebaneseLiberianLithuanianLumbeeLuxembourgerMacedonianMalaysianMalteseMarshalleseMenomineeMexicanMexican American IndianMongolianMoroccanNative HawaiianNavajoNepaleseNew ZealanderNicaraguanNigerianNorthern EuropeanNorwegianOkinawanOsageOttawaPaiutePakistaniPalestinianPanamanianParaguayanPennsylvania GermanPeruvianPimaPolishPortuguesePotawatomiPuebloPuerto RicanPuget Sound SalishRomanianRussianSalvadoranSamoanScandinavianScotch-IrishScottishSeminoleSenegaleseSerbianShoshoneSierra LeoneanSiouxSlavicSlovakSloveneSomaliSouth AfricanSouth AmericanSouth American IndianSoviet UnionSpaniardSpanishSpanish AmericanSpanish American IndianSri LankanSubsaharan AfricanSudaneseSwedishSwissSyrianTaiwaneseThaiTlingit-HaidaTohono O'OdhamTonganTrinidadian and TobagonianTsimshianTurkishU.S. Virgin IslanderUgandanUkrainianUruguayanUteVenezuelanVietnameseWelshWest IndianYakamaYaquiYugoslavianYumanYup'ikZimbabwean
Immigration
NonimmigrantsImmigrantsAfghanistanAfricaAlbaniaArgentinaArmeniaAsiaAustraliaAustriaBahamasBangladeshBarbadosBelarusBelgiumBelizeBoliviaBosnia and HerzegovinaBrazilBulgariaBurma/MyanmarCabo VerdeCambodiaCameroonCanadaCaribbeanCentral AmericaChileChinaColombiaCongoCosta RicaCroatiaCubaCzechoslovakiaDenmarkDominicaDominican RepublicEastern AfricaEastern AsiaEastern EuropeEcuadorEgyptEl SalvadorEnglandEritreaEthiopiaEuropeFijiFranceGermanyGhanaGreeceGrenadaGuatemalaGuyanaHaitiHondurasHong KongHungaryIndiaIndonesiaIranIraqIrelandIsraelItalyJamaicaJapanJordanKazakhstanKenyaKoreaKuwaitLaosLatin AmericaLatviaLebanonLiberiaLithuaniaMalaysiaMexicoMicronesiaMiddle AfricaMoldovaMoroccoNepalNetherlandsNicaraguaNigeriaNorth AmericaNorth MacedoniaNorthern AfricaNorthern EuropeNorwayOceaniaPakistanPanamaPeruPhilippinesPolandPortugalRomaniaRussiaSaudi ArabiaScotlandSenegalSerbiaSierra LeoneSingaporeSomaliaSouth AfricaSouth AmericaSouth Central AsiaSouth Eastern AsiaSouthern EuropeSpainSri LankaSt. Vincent and the GrenadinesSudanSwedenSwitzerlandSyriaTaiwanThailandTrinidad and TobagoTurkeyUgandaUkraineUruguayUzbekistanVenezuelaVietnamWest IndiesWestern AfricaWestern AsiaWestern EuropeZaireZimbabweAzores
Immigrants from Yemen
Race
Ancestry
AfghanAfricanAlaska NativeAlaskan AthabascanAlbanianAleutAlsatianAmericanApacheArabArapahoArgentineanArmenianAssyrian/Chaldean/SyriacAustralianAustrianBahamianBangladeshiBarbadianBasqueBelgianBelizeanBermudanBhutaneseBlackfeetBolivianBrazilianBritishBritish West IndianBulgarianBurmeseCajunCambodianCanadianCape VerdeanCarpatho RusynCelticCentral AmericanCentral American IndianCherokeeCheyenneChickasawChileanChineseChippewaChoctawColombianColvilleComancheCosta RicanCreeCreekCroatianCrowCubanCypriotCzechCzechoslovakianDanishDelawareDominicanDutchDutch West IndianEastern EuropeanEcuadorianEgyptianEnglishEstonianEthiopianEuropeanFijianFilipinoFinnishFrenchFrench American IndianFrench CanadianGermanGerman RussianGhanaianGreekGuamanian/ChamorroGuatemalanGuyaneseHaitianHmongHonduranHopiHoumaHungarianIcelanderIndian (Asian)IndonesianInupiatIranianIraqiIrishIroquoisIsraeliItalianJamaicanJapaneseJordanianKenyanKiowaKoreanLaotianLatvianLebaneseLiberianLithuanianLumbeeLuxembourgerMalaysianMalteseMarshalleseMenomineeMexicanMexican American IndianMongolianMoroccanNative HawaiianNavajoNepaleseNew ZealanderNicaraguanNigerianNorthern EuropeanNorwegianOkinawanOsageOttawaPaiutePakistaniPalestinianPanamanianParaguayanPennsylvania GermanPeruvianPimaPolishPortuguesePotawatomiPuebloPuerto RicanPuget Sound SalishRomanianRussianSalvadoranSamoanScandinavianScotch-IrishScottishSeminoleSenegaleseSerbianShoshoneSierra LeoneanSiouxSlavicSlovakSloveneSomaliSouth AfricanSouth AmericanSouth American IndianSoviet UnionSpaniardSpanishSpanish AmericanSpanish American IndianSri LankanSubsaharan AfricanSudaneseSwedishSwissSyrianTaiwaneseThaiTlingit-HaidaTohono O'OdhamTonganTrinidadian and TobagonianTsimshianTurkishU.S. Virgin IslanderUgandanUkrainianUruguayanUteVenezuelanVietnameseWelshWest IndianYakamaYaquiYugoslavianYumanYup'ikZimbabwean
Immigration
NonimmigrantsImmigrantsAfghanistanAfricaAlbaniaArgentinaArmeniaAsiaAustraliaAustriaBahamasBangladeshBarbadosBelarusBelgiumBelizeBoliviaBosnia and HerzegovinaBrazilBulgariaBurma/MyanmarCabo VerdeCambodiaCameroonCanadaCaribbeanCentral AmericaChileChinaColombiaCongoCosta RicaCroatiaCubaCzechoslovakiaDenmarkDominicaDominican RepublicEastern AfricaEastern AsiaEastern EuropeEcuadorEgyptEl SalvadorEnglandEritreaEthiopiaEuropeFijiFranceGermanyGhanaGreeceGrenadaGuatemalaGuyanaHaitiHondurasHong KongHungaryIndiaIndonesiaIranIraqIrelandIsraelItalyJamaicaJapanJordanKazakhstanKenyaKoreaKuwaitLaosLatin AmericaLatviaLebanonLiberiaLithuaniaMalaysiaMexicoMicronesiaMiddle AfricaMoldovaMoroccoNepalNetherlandsNicaraguaNigeriaNorth AmericaNorth MacedoniaNorthern AfricaNorthern EuropeNorwayOceaniaPakistanPanamaPeruPhilippinesPolandPortugalRomaniaRussiaSaudi ArabiaScotlandSenegalSerbiaSierra LeoneSingaporeSomaliaSouth AfricaSouth AmericaSouth Central AsiaSouth Eastern AsiaSouthern EuropeSpainSri LankaSt. Vincent and the GrenadinesSudanSwedenSwitzerlandSyriaTaiwanThailandTrinidad and TobagoTurkeyUgandaUkraineUruguayUzbekistanVenezuelaVietnamWest IndiesWestern AfricaWestern AsiaWestern EuropeYemenZaireZimbabweAzores
5th Grade
Income
Poverty
Unemployment
Labor Participation
Family Structure
Vehicle Availability
Education Level
Disability

5th Grade Comparison

Macedonians

Immigrants from Yemen

Exceptional
Tragic
97.9%
5TH GRADE
99.4/ 100
METRIC RATING
72nd/ 347
METRIC RANK
94.9%
5TH GRADE
0.0/ 100
METRIC RATING
339th/ 347
METRIC RANK

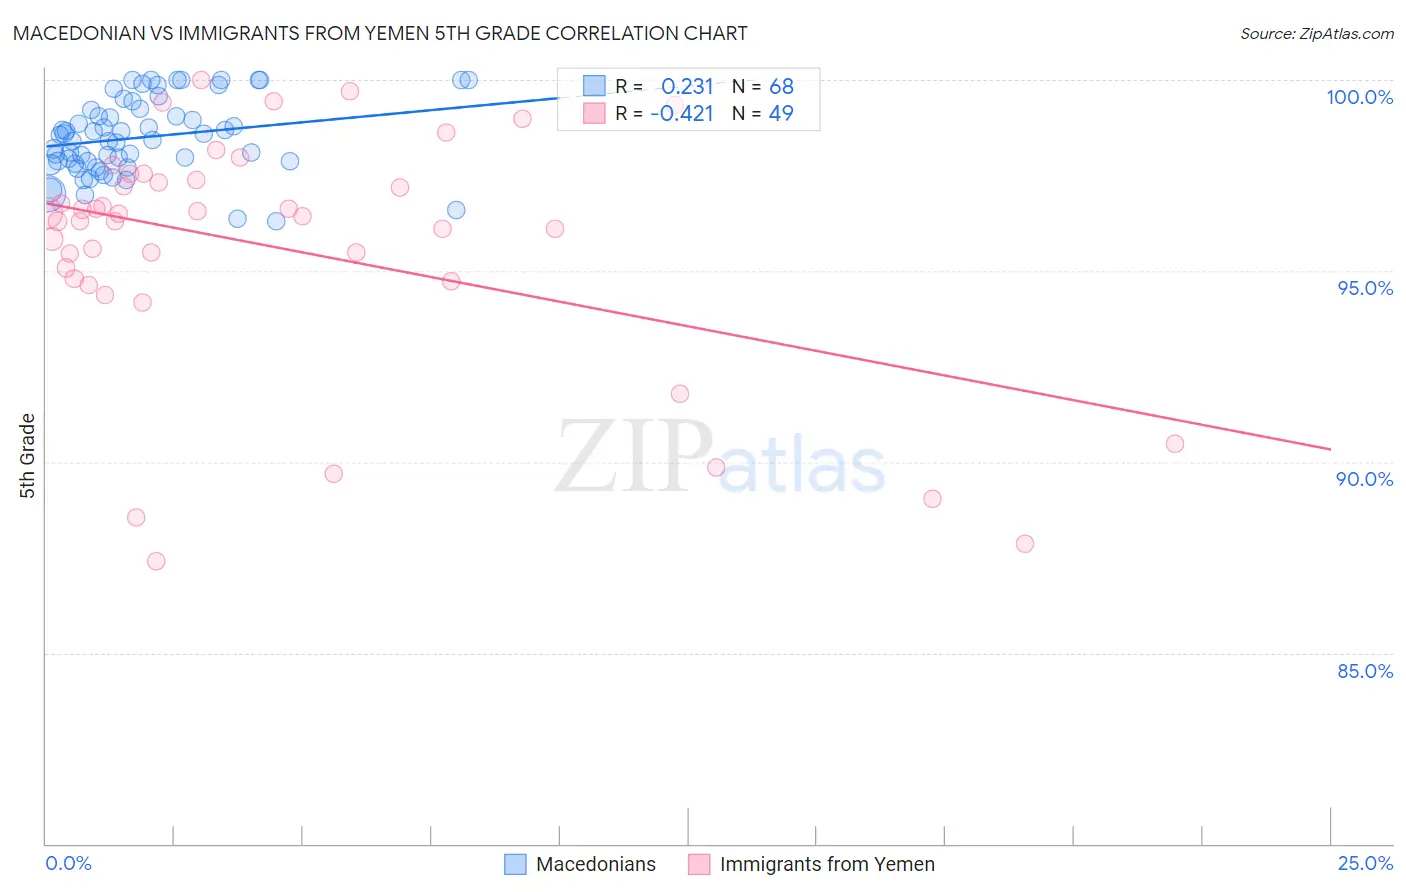
Macedonian vs Immigrants from Yemen 5th Grade Correlation Chart

The statistical analysis conducted on geographies consisting of 132,592,860 people shows a weak positive correlation between the proportion of Macedonians and percentage of population with at least 5th grade education in the United States with a correlation coefficient (R) of 0.231 and weighted average of 97.9%. Similarly, the statistical analysis conducted on geographies consisting of 82,429,885 people shows a moderate negative correlation between the proportion of Immigrants from Yemen and percentage of population with at least 5th grade education in the United States with a correlation coefficient (R) of -0.421 and weighted average of 94.9%, a difference of 3.2%.
Macedonian vs Immigrants from Yemen 5th Grade

5th Grade Correlation Summary

MeasurementMacedonianImmigrants from Yemen
Minimum96.3%87.4%
Maximum100.0%100.0%
Range3.7%12.6%
Mean98.5%95.6%
Median98.5%96.4%
Interquartile 25% (IQ1)97.8%94.8%
Interquartile 75% (IQ3)99.2%97.5%
Interquartile Range (IQR)1.4%2.7%
Standard Deviation (Sample)0.99%3.2%
Standard Deviation (Population)0.98%3.1%

Similar Demographics by 5th Grade

Demographics Similar to Macedonians by 5th Grade

In terms of 5th grade, the demographic groups most similar to Macedonians are Iranian (97.9%, a difference of 0.010%), Chickasaw (97.9%, a difference of 0.010%), Cherokee (97.8%, a difference of 0.010%), Kiowa (97.9%, a difference of 0.020%), and Lumbee (97.8%, a difference of 0.020%).
DemographicsRating | Rank5th Grade
Canadians
99.6
/100
|
#65
Exceptional
97.9%
Immigrants | Austria
99.6
/100
|
#66
Exceptional
97.9%
New Zealanders
99.6
/100
|
#67
Exceptional
97.9%
Cajuns
99.6
/100
|
#68
Exceptional
97.9%
Kiowa
99.5
/100
|
#69
Exceptional
97.9%
Iranians
99.5
/100
|
#70
Exceptional
97.9%
Chickasaw
99.5
/100
|
#71
Exceptional
97.9%
Macedonians
99.4
/100
|
#72
Exceptional
97.9%
Cherokee
99.4
/100
|
#73
Exceptional
97.8%
Lumbee
99.3
/100
|
#74
Exceptional
97.8%
Ukrainians
99.3
/100
|
#75
Exceptional
97.8%
Immigrants | Netherlands
99.3
/100
|
#76
Exceptional
97.8%
Immigrants | England
99.3
/100
|
#77
Exceptional
97.8%
Osage
99.3
/100
|
#78
Exceptional
97.8%
Immigrants | Lithuania
99.2
/100
|
#79
Exceptional
97.8%

Demographics Similar to Immigrants from Yemen by 5th Grade

In terms of 5th grade, the demographic groups most similar to Immigrants from Yemen are Guatemalan (94.8%, a difference of 0.030%), Immigrants from Cabo Verde (94.9%, a difference of 0.050%), Yakama (94.8%, a difference of 0.10%), Central American (95.1%, a difference of 0.21%), and Immigrants from Central America (94.7%, a difference of 0.21%).
DemographicsRating | Rank5th Grade
Immigrants | Dominican Republic
0.0
/100
|
#332
Tragic
95.3%
Immigrants | Latin America
0.0
/100
|
#333
Tragic
95.3%
Nepalese
0.0
/100
|
#334
Tragic
95.2%
Mexicans
0.0
/100
|
#335
Tragic
95.2%
Immigrants | Azores
0.0
/100
|
#336
Tragic
95.1%
Central Americans
0.0
/100
|
#337
Tragic
95.1%
Immigrants | Cabo Verde
0.0
/100
|
#338
Tragic
94.9%
Immigrants | Yemen
0.0
/100
|
#339
Tragic
94.9%
Guatemalans
0.0
/100
|
#340
Tragic
94.8%
Yakama
0.0
/100
|
#341
Tragic
94.8%
Immigrants | Central America
0.0
/100
|
#342
Tragic
94.7%
Salvadorans
0.0
/100
|
#343
Tragic
94.6%
Immigrants | Mexico
0.0
/100
|
#344
Tragic
94.6%
Immigrants | Guatemala
0.0
/100
|
#345
Tragic
94.6%
Immigrants | El Salvador
0.0
/100
|
#346
Tragic
94.3%