Luxembourger vs Immigrants from Vietnam 4th Grade

COMPARE

Luxembourger
Race
Ancestry
AfghanAfricanAlaska NativeAlaskan AthabascanAlbanianAleutAlsatianAmericanApacheArabArapahoArgentineanArmenianAssyrian/Chaldean/SyriacAustralianAustrianBahamianBangladeshiBarbadianBasqueBelgianBelizeanBermudanBhutaneseBlackfeetBolivianBrazilianBritishBritish West IndianBulgarianBurmeseCajunCambodianCanadianCape VerdeanCarpatho RusynCelticCentral AmericanCentral American IndianCherokeeCheyenneChickasawChileanChineseChippewaChoctawColombianColvilleComancheCosta RicanCreeCreekCroatianCrowCubanCypriotCzechCzechoslovakianDanishDelawareDominicanDutchDutch West IndianEastern EuropeanEcuadorianEgyptianEnglishEstonianEthiopianEuropeanFijianFilipinoFinnishFrenchFrench American IndianFrench CanadianGermanGerman RussianGhanaianGreekGuamanian/ChamorroGuatemalanGuyaneseHaitianHmongHonduranHopiHoumaHungarianIcelanderIndian (Asian)IndonesianInupiatIranianIraqiIrishIroquoisIsraeliItalianJamaicanJapaneseJordanianKenyanKiowaKoreanLaotianLatvianLebaneseLiberianLithuanianLumbeeLuxembourgerMacedonianMalaysianMalteseMarshalleseMenomineeMexicanMexican American IndianMongolianMoroccanNative HawaiianNavajoNepaleseNew ZealanderNicaraguanNigerianNorthern EuropeanNorwegianOkinawanOsageOttawaPaiutePakistaniPalestinianPanamanianParaguayanPennsylvania GermanPeruvianPimaPolishPortuguesePotawatomiPuebloPuerto RicanPuget Sound SalishRomanianRussianSalvadoranSamoanScandinavianScotch-IrishScottishSeminoleSenegaleseSerbianShoshoneSierra LeoneanSiouxSlavicSlovakSloveneSomaliSouth AfricanSouth AmericanSouth American IndianSoviet UnionSpaniardSpanishSpanish AmericanSpanish American IndianSri LankanSubsaharan AfricanSudaneseSwedishSwissSyrianTaiwaneseThaiTlingit-HaidaTohono O'OdhamTonganTrinidadian and TobagonianTsimshianTurkishU.S. Virgin IslanderUgandanUkrainianUruguayanUteVenezuelanVietnameseWelshWest IndianYakamaYaquiYugoslavianYumanYup'ikZimbabwean
Immigration
NonimmigrantsImmigrantsAfghanistanAfricaAlbaniaArgentinaArmeniaAsiaAustraliaAustriaBahamasBangladeshBarbadosBelarusBelgiumBelizeBoliviaBosnia and HerzegovinaBrazilBulgariaBurma/MyanmarCabo VerdeCambodiaCameroonCanadaCaribbeanCentral AmericaChileChinaColombiaCongoCosta RicaCroatiaCubaCzechoslovakiaDenmarkDominicaDominican RepublicEastern AfricaEastern AsiaEastern EuropeEcuadorEgyptEl SalvadorEnglandEritreaEthiopiaEuropeFijiFranceGermanyGhanaGreeceGrenadaGuatemalaGuyanaHaitiHondurasHong KongHungaryIndiaIndonesiaIranIraqIrelandIsraelItalyJamaicaJapanJordanKazakhstanKenyaKoreaKuwaitLaosLatin AmericaLatviaLebanonLiberiaLithuaniaMalaysiaMexicoMicronesiaMiddle AfricaMoldovaMoroccoNepalNetherlandsNicaraguaNigeriaNorth AmericaNorth MacedoniaNorthern AfricaNorthern EuropeNorwayOceaniaPakistanPanamaPeruPhilippinesPolandPortugalRomaniaRussiaSaudi ArabiaScotlandSenegalSerbiaSierra LeoneSingaporeSomaliaSouth AfricaSouth AmericaSouth Central AsiaSouth Eastern AsiaSouthern EuropeSpainSri LankaSt. Vincent and the GrenadinesSudanSwedenSwitzerlandSyriaTaiwanThailandTrinidad and TobagoTurkeyUgandaUkraineUruguayUzbekistanVenezuelaWest IndiesWestern AfricaWestern AsiaWestern EuropeYemenZaireZimbabweAzores
Immigrants from Vietnam
Race
Ancestry
AfghanAfricanAlaska NativeAlaskan AthabascanAlbanianAleutAlsatianAmericanApacheArabArapahoArgentineanArmenianAssyrian/Chaldean/SyriacAustralianAustrianBahamianBangladeshiBarbadianBasqueBelgianBelizeanBermudanBhutaneseBlackfeetBolivianBrazilianBritishBritish West IndianBulgarianBurmeseCajunCambodianCanadianCape VerdeanCarpatho RusynCelticCentral AmericanCentral American IndianCherokeeCheyenneChickasawChileanChineseChippewaChoctawColombianColvilleComancheCosta RicanCreeCreekCroatianCrowCubanCypriotCzechCzechoslovakianDanishDelawareDominicanDutchDutch West IndianEastern EuropeanEcuadorianEgyptianEnglishEstonianEthiopianEuropeanFijianFilipinoFinnishFrenchFrench American IndianFrench CanadianGermanGerman RussianGhanaianGreekGuamanian/ChamorroGuatemalanGuyaneseHaitianHmongHonduranHopiHoumaHungarianIcelanderIndian (Asian)IndonesianInupiatIranianIraqiIrishIroquoisIsraeliItalianJamaicanJapaneseJordanianKenyanKiowaKoreanLaotianLatvianLebaneseLiberianLithuanianLumbeeMacedonianMalaysianMalteseMarshalleseMenomineeMexicanMexican American IndianMongolianMoroccanNative HawaiianNavajoNepaleseNew ZealanderNicaraguanNigerianNorthern EuropeanNorwegianOkinawanOsageOttawaPaiutePakistaniPalestinianPanamanianParaguayanPennsylvania GermanPeruvianPimaPolishPortuguesePotawatomiPuebloPuerto RicanPuget Sound SalishRomanianRussianSalvadoranSamoanScandinavianScotch-IrishScottishSeminoleSenegaleseSerbianShoshoneSierra LeoneanSiouxSlavicSlovakSloveneSomaliSouth AfricanSouth AmericanSouth American IndianSoviet UnionSpaniardSpanishSpanish AmericanSpanish American IndianSri LankanSubsaharan AfricanSudaneseSwedishSwissSyrianTaiwaneseThaiTlingit-HaidaTohono O'OdhamTonganTrinidadian and TobagonianTsimshianTurkishU.S. Virgin IslanderUgandanUkrainianUruguayanUteVenezuelanVietnameseWelshWest IndianYakamaYaquiYugoslavianYumanYup'ikZimbabwean
Immigration
NonimmigrantsImmigrantsAfghanistanAfricaAlbaniaArgentinaArmeniaAsiaAustraliaAustriaBahamasBangladeshBarbadosBelarusBelgiumBelizeBoliviaBosnia and HerzegovinaBrazilBulgariaBurma/MyanmarCabo VerdeCambodiaCameroonCanadaCaribbeanCentral AmericaChileChinaColombiaCongoCosta RicaCroatiaCubaCzechoslovakiaDenmarkDominicaDominican RepublicEastern AfricaEastern AsiaEastern EuropeEcuadorEgyptEl SalvadorEnglandEritreaEthiopiaEuropeFijiFranceGermanyGhanaGreeceGrenadaGuatemalaGuyanaHaitiHondurasHong KongHungaryIndiaIndonesiaIranIraqIrelandIsraelItalyJamaicaJapanJordanKazakhstanKenyaKoreaKuwaitLaosLatin AmericaLatviaLebanonLiberiaLithuaniaMalaysiaMexicoMicronesiaMiddle AfricaMoldovaMoroccoNepalNetherlandsNicaraguaNigeriaNorth AmericaNorth MacedoniaNorthern AfricaNorthern EuropeNorwayOceaniaPakistanPanamaPeruPhilippinesPolandPortugalRomaniaRussiaSaudi ArabiaScotlandSenegalSerbiaSierra LeoneSingaporeSomaliaSouth AfricaSouth AmericaSouth Central AsiaSouth Eastern AsiaSouthern EuropeSpainSri LankaSt. Vincent and the GrenadinesSudanSwedenSwitzerlandSyriaTaiwanThailandTrinidad and TobagoTurkeyUgandaUkraineUruguayUzbekistanVenezuelaVietnamWest IndiesWestern AfricaWestern AsiaWestern EuropeYemenZaireZimbabweAzores
4th Grade
Income
Poverty
Unemployment
Labor Participation
Family Structure
Vehicle Availability
Education Level
Disability

4th Grade Comparison

Luxembourgers

Immigrants from Vietnam

Exceptional
Tragic
98.2%
4TH GRADE
99.9/ 100
METRIC RATING
40th/ 347
METRIC RANK
96.0%
4TH GRADE
0.0/ 100
METRIC RATING
322nd/ 347
METRIC RANK

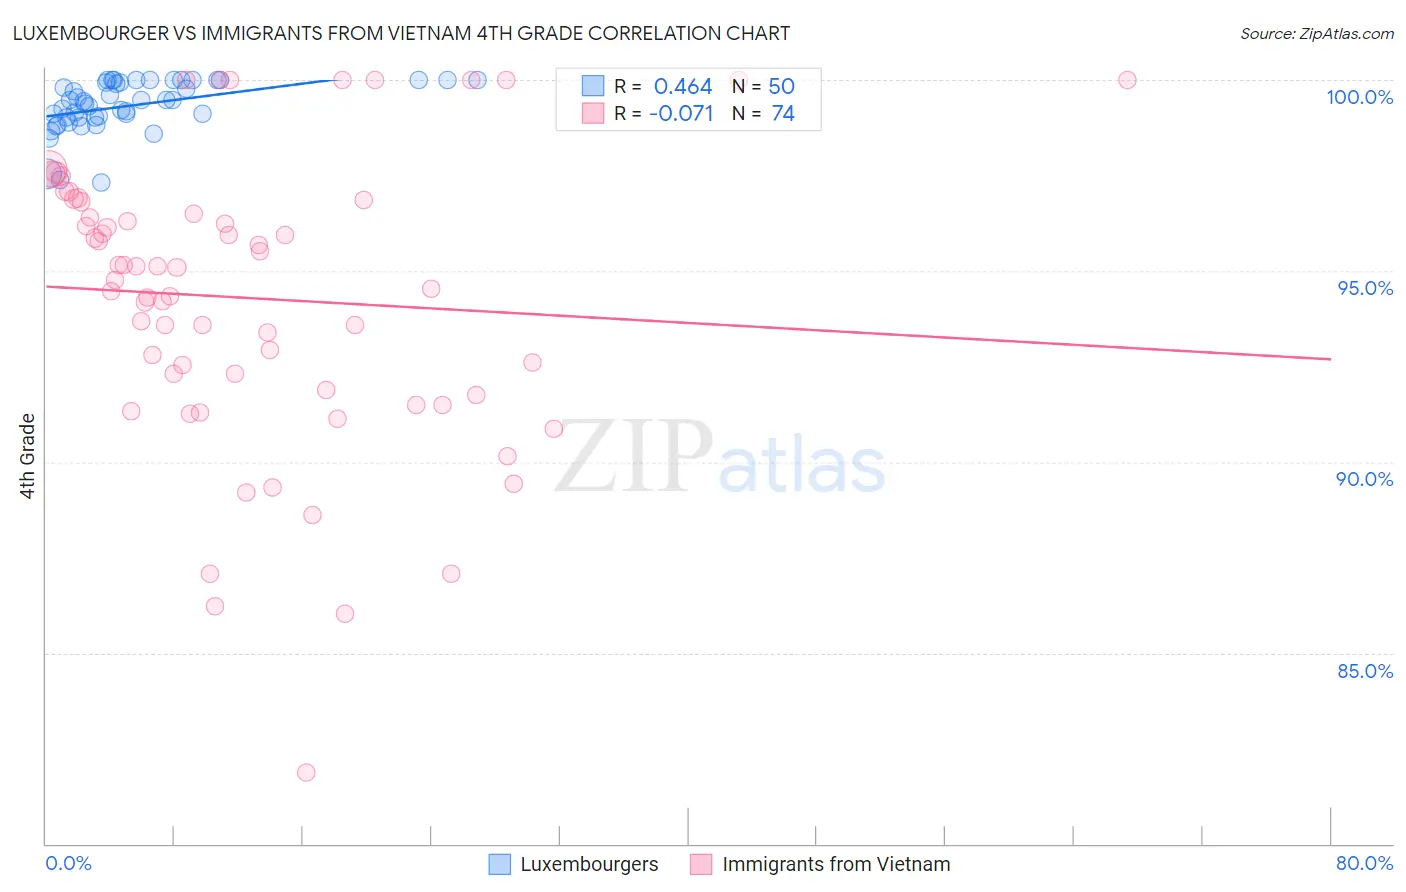
Luxembourger vs Immigrants from Vietnam 4th Grade Correlation Chart

The statistical analysis conducted on geographies consisting of 144,675,126 people shows a moderate positive correlation between the proportion of Luxembourgers and percentage of population with at least 4th grade education in the United States with a correlation coefficient (R) of 0.464 and weighted average of 98.2%. Similarly, the statistical analysis conducted on geographies consisting of 404,844,130 people shows a slight negative correlation between the proportion of Immigrants from Vietnam and percentage of population with at least 4th grade education in the United States with a correlation coefficient (R) of -0.071 and weighted average of 96.0%, a difference of 2.3%.
Luxembourger vs Immigrants from Vietnam 4th Grade

4th Grade Correlation Summary

MeasurementLuxembourgerImmigrants from Vietnam
Minimum97.3%81.9%
Maximum100.0%100.0%
Range2.7%18.1%
Mean99.3%94.3%
Median99.4%94.9%
Interquartile 25% (IQ1)99.0%91.9%
Interquartile 75% (IQ3)100.0%96.8%
Interquartile Range (IQR)0.99%4.9%
Standard Deviation (Sample)0.67%3.8%
Standard Deviation (Population)0.67%3.7%

Similar Demographics by 4th Grade

Demographics Similar to Luxembourgers by 4th Grade

In terms of 4th grade, the demographic groups most similar to Luxembourgers are Belgian (98.2%, a difference of 0.0%), Eastern European (98.2%, a difference of 0.0%), Latvian (98.2%, a difference of 0.010%), Aleut (98.2%, a difference of 0.010%), and British (98.2%, a difference of 0.030%).
DemographicsRating | Rank4th Grade
Swiss
100.0
/100
|
#33
Exceptional
98.2%
Chippewa
100.0
/100
|
#34
Exceptional
98.2%
Italians
100.0
/100
|
#35
Exceptional
98.2%
British
100.0
/100
|
#36
Exceptional
98.2%
Latvians
99.9
/100
|
#37
Exceptional
98.2%
Aleuts
99.9
/100
|
#38
Exceptional
98.2%
Belgians
99.9
/100
|
#39
Exceptional
98.2%
Luxembourgers
99.9
/100
|
#40
Exceptional
98.2%
Eastern Europeans
99.9
/100
|
#41
Exceptional
98.2%
Hungarians
99.9
/100
|
#42
Exceptional
98.2%
Northern Europeans
99.9
/100
|
#43
Exceptional
98.2%
Native Hawaiians
99.9
/100
|
#44
Exceptional
98.1%
Czechoslovakians
99.9
/100
|
#45
Exceptional
98.1%
Ottawa
99.9
/100
|
#46
Exceptional
98.1%
Arapaho
99.9
/100
|
#47
Exceptional
98.1%

Demographics Similar to Immigrants from Vietnam by 4th Grade

In terms of 4th grade, the demographic groups most similar to Immigrants from Vietnam are Japanese (96.0%, a difference of 0.0%), Immigrants from Nicaragua (96.0%, a difference of 0.020%), Immigrants from Belize (96.0%, a difference of 0.030%), Dominican (96.0%, a difference of 0.040%), and Hispanic or Latino (96.0%, a difference of 0.050%).
DemographicsRating | Rank4th Grade
Nicaraguans
0.0
/100
|
#315
Tragic
96.2%
Immigrants | Ecuador
0.0
/100
|
#316
Tragic
96.2%
Central American Indians
0.0
/100
|
#317
Tragic
96.2%
Immigrants | Azores
0.0
/100
|
#318
Tragic
96.1%
Belizeans
0.0
/100
|
#319
Tragic
96.1%
Bangladeshis
0.0
/100
|
#320
Tragic
96.1%
Japanese
0.0
/100
|
#321
Tragic
96.0%
Immigrants | Vietnam
0.0
/100
|
#322
Tragic
96.0%
Immigrants | Nicaragua
0.0
/100
|
#323
Tragic
96.0%
Immigrants | Belize
0.0
/100
|
#324
Tragic
96.0%
Dominicans
0.0
/100
|
#325
Tragic
96.0%
Hispanics or Latinos
0.0
/100
|
#326
Tragic
96.0%
Hondurans
0.0
/100
|
#327
Tragic
96.0%
Mexican American Indians
0.0
/100
|
#328
Tragic
95.8%
Immigrants | Cambodia
0.0
/100
|
#329
Tragic
95.8%