Lumbee vs Soviet Union 4th Grade

COMPARE

Lumbee
Race
Ancestry
AfghanAfricanAlaska NativeAlaskan AthabascanAlbanianAleutAlsatianAmericanApacheArabArapahoArgentineanArmenianAssyrian/Chaldean/SyriacAustralianAustrianBahamianBangladeshiBarbadianBasqueBelgianBelizeanBermudanBhutaneseBlackfeetBolivianBrazilianBritishBritish West IndianBulgarianBurmeseCajunCambodianCanadianCape VerdeanCarpatho RusynCelticCentral AmericanCentral American IndianCherokeeCheyenneChickasawChileanChineseChippewaChoctawColombianColvilleComancheCosta RicanCreeCreekCroatianCrowCubanCypriotCzechCzechoslovakianDanishDelawareDominicanDutchDutch West IndianEastern EuropeanEcuadorianEgyptianEnglishEstonianEthiopianEuropeanFijianFilipinoFinnishFrenchFrench American IndianFrench CanadianGermanGerman RussianGhanaianGreekGuamanian/ChamorroGuatemalanGuyaneseHaitianHmongHonduranHopiHoumaHungarianIcelanderIndian (Asian)IndonesianInupiatIranianIraqiIrishIroquoisIsraeliItalianJamaicanJapaneseJordanianKenyanKiowaKoreanLaotianLatvianLebaneseLiberianLithuanianLumbeeLuxembourgerMacedonianMalaysianMalteseMarshalleseMenomineeMexicanMexican American IndianMongolianMoroccanNative HawaiianNavajoNepaleseNew ZealanderNicaraguanNigerianNorthern EuropeanNorwegianOkinawanOsageOttawaPaiutePakistaniPalestinianPanamanianParaguayanPennsylvania GermanPeruvianPimaPolishPortuguesePotawatomiPuebloPuerto RicanPuget Sound SalishRomanianRussianSalvadoranSamoanScandinavianScotch-IrishScottishSeminoleSenegaleseSerbianShoshoneSierra LeoneanSiouxSlavicSlovakSloveneSomaliSouth AfricanSouth AmericanSouth American IndianSpaniardSpanishSpanish AmericanSpanish American IndianSri LankanSubsaharan AfricanSudaneseSwedishSwissSyrianTaiwaneseThaiTlingit-HaidaTohono O'OdhamTonganTrinidadian and TobagonianTsimshianTurkishU.S. Virgin IslanderUgandanUkrainianUruguayanUteVenezuelanVietnameseWelshWest IndianYakamaYaquiYugoslavianYumanYup'ikZimbabwean
Immigration
NonimmigrantsImmigrantsAfghanistanAfricaAlbaniaArgentinaArmeniaAsiaAustraliaAustriaBahamasBangladeshBarbadosBelarusBelgiumBelizeBoliviaBosnia and HerzegovinaBrazilBulgariaBurma/MyanmarCabo VerdeCambodiaCameroonCanadaCaribbeanCentral AmericaChileChinaColombiaCongoCosta RicaCroatiaCubaCzechoslovakiaDenmarkDominicaDominican RepublicEastern AfricaEastern AsiaEastern EuropeEcuadorEgyptEl SalvadorEnglandEritreaEthiopiaEuropeFijiFranceGermanyGhanaGreeceGrenadaGuatemalaGuyanaHaitiHondurasHong KongHungaryIndiaIndonesiaIranIraqIrelandIsraelItalyJamaicaJapanJordanKazakhstanKenyaKoreaKuwaitLaosLatin AmericaLatviaLebanonLiberiaLithuaniaMalaysiaMexicoMicronesiaMiddle AfricaMoldovaMoroccoNepalNetherlandsNicaraguaNigeriaNorth AmericaNorth MacedoniaNorthern AfricaNorthern EuropeNorwayOceaniaPakistanPanamaPeruPhilippinesPolandPortugalRomaniaRussiaSaudi ArabiaScotlandSenegalSerbiaSierra LeoneSingaporeSomaliaSouth AfricaSouth AmericaSouth Central AsiaSouth Eastern AsiaSouthern EuropeSpainSri LankaSt. Vincent and the GrenadinesSudanSwedenSwitzerlandSyriaTaiwanThailandTrinidad and TobagoTurkeyUgandaUkraineUruguayUzbekistanVenezuelaVietnamWest IndiesWestern AfricaWestern AsiaWestern EuropeYemenZaireZimbabweAzores
Soviet Union
Race
Ancestry
AfghanAfricanAlaska NativeAlaskan AthabascanAlbanianAleutAlsatianAmericanApacheArabArapahoArgentineanArmenianAssyrian/Chaldean/SyriacAustralianAustrianBahamianBangladeshiBarbadianBasqueBelgianBelizeanBermudanBhutaneseBlackfeetBolivianBrazilianBritishBritish West IndianBulgarianBurmeseCajunCambodianCanadianCape VerdeanCarpatho RusynCelticCentral AmericanCentral American IndianCherokeeCheyenneChickasawChileanChineseChippewaChoctawColombianColvilleComancheCosta RicanCreeCreekCroatianCrowCubanCypriotCzechCzechoslovakianDanishDelawareDominicanDutchDutch West IndianEastern EuropeanEcuadorianEgyptianEnglishEstonianEthiopianEuropeanFijianFilipinoFinnishFrenchFrench American IndianFrench CanadianGermanGerman RussianGhanaianGreekGuamanian/ChamorroGuatemalanGuyaneseHaitianHmongHonduranHopiHoumaHungarianIcelanderIndian (Asian)IndonesianInupiatIranianIraqiIrishIroquoisIsraeliItalianJamaicanJapaneseJordanianKenyanKiowaKoreanLaotianLatvianLebaneseLiberianLithuanianLuxembourgerMacedonianMalaysianMalteseMarshalleseMenomineeMexicanMexican American IndianMongolianMoroccanNative HawaiianNavajoNepaleseNew ZealanderNicaraguanNigerianNorthern EuropeanNorwegianOkinawanOsageOttawaPaiutePakistaniPalestinianPanamanianParaguayanPennsylvania GermanPeruvianPimaPolishPortuguesePotawatomiPuebloPuerto RicanPuget Sound SalishRomanianRussianSalvadoranSamoanScandinavianScotch-IrishScottishSeminoleSenegaleseSerbianShoshoneSierra LeoneanSiouxSlavicSlovakSloveneSomaliSouth AfricanSouth AmericanSouth American IndianSoviet UnionSpaniardSpanishSpanish AmericanSpanish American IndianSri LankanSubsaharan AfricanSudaneseSwedishSwissSyrianTaiwaneseThaiTlingit-HaidaTohono O'OdhamTonganTrinidadian and TobagonianTsimshianTurkishU.S. Virgin IslanderUgandanUkrainianUruguayanUteVenezuelanVietnameseWelshWest IndianYakamaYaquiYugoslavianYumanYup'ikZimbabwean
Immigration
NonimmigrantsImmigrantsAfghanistanAfricaAlbaniaArgentinaArmeniaAsiaAustraliaAustriaBahamasBangladeshBarbadosBelarusBelgiumBelizeBoliviaBosnia and HerzegovinaBrazilBulgariaBurma/MyanmarCabo VerdeCambodiaCameroonCanadaCaribbeanCentral AmericaChileChinaColombiaCongoCosta RicaCroatiaCubaCzechoslovakiaDenmarkDominicaDominican RepublicEastern AfricaEastern AsiaEastern EuropeEcuadorEgyptEl SalvadorEnglandEritreaEthiopiaEuropeFijiFranceGermanyGhanaGreeceGrenadaGuatemalaGuyanaHaitiHondurasHong KongHungaryIndiaIndonesiaIranIraqIrelandIsraelItalyJamaicaJapanJordanKazakhstanKenyaKoreaKuwaitLaosLatin AmericaLatviaLebanonLiberiaLithuaniaMalaysiaMexicoMicronesiaMiddle AfricaMoldovaMoroccoNepalNetherlandsNicaraguaNigeriaNorth AmericaNorth MacedoniaNorthern AfricaNorthern EuropeNorwayOceaniaPakistanPanamaPeruPhilippinesPolandPortugalRomaniaRussiaSaudi ArabiaScotlandSenegalSerbiaSierra LeoneSingaporeSomaliaSouth AfricaSouth AmericaSouth Central AsiaSouth Eastern AsiaSouthern EuropeSpainSri LankaSt. Vincent and the GrenadinesSudanSwedenSwitzerlandSyriaTaiwanThailandTrinidad and TobagoTurkeyUgandaUkraineUruguayUzbekistanVenezuelaVietnamWest IndiesWestern AfricaWestern AsiaWestern EuropeYemenZaireZimbabweAzores
4th Grade
Income
Poverty
Unemployment
Labor Participation
Family Structure
Vehicle Availability
Education Level
Disability

4th Grade Comparison

Lumbee

Soviet Union

Exceptional
Good
98.0%
4TH GRADE
99.6/ 100
METRIC RATING
71st/ 347
METRIC RANK
97.6%
4TH GRADE
77.8/ 100
METRIC RATING
149th/ 347
METRIC RANK

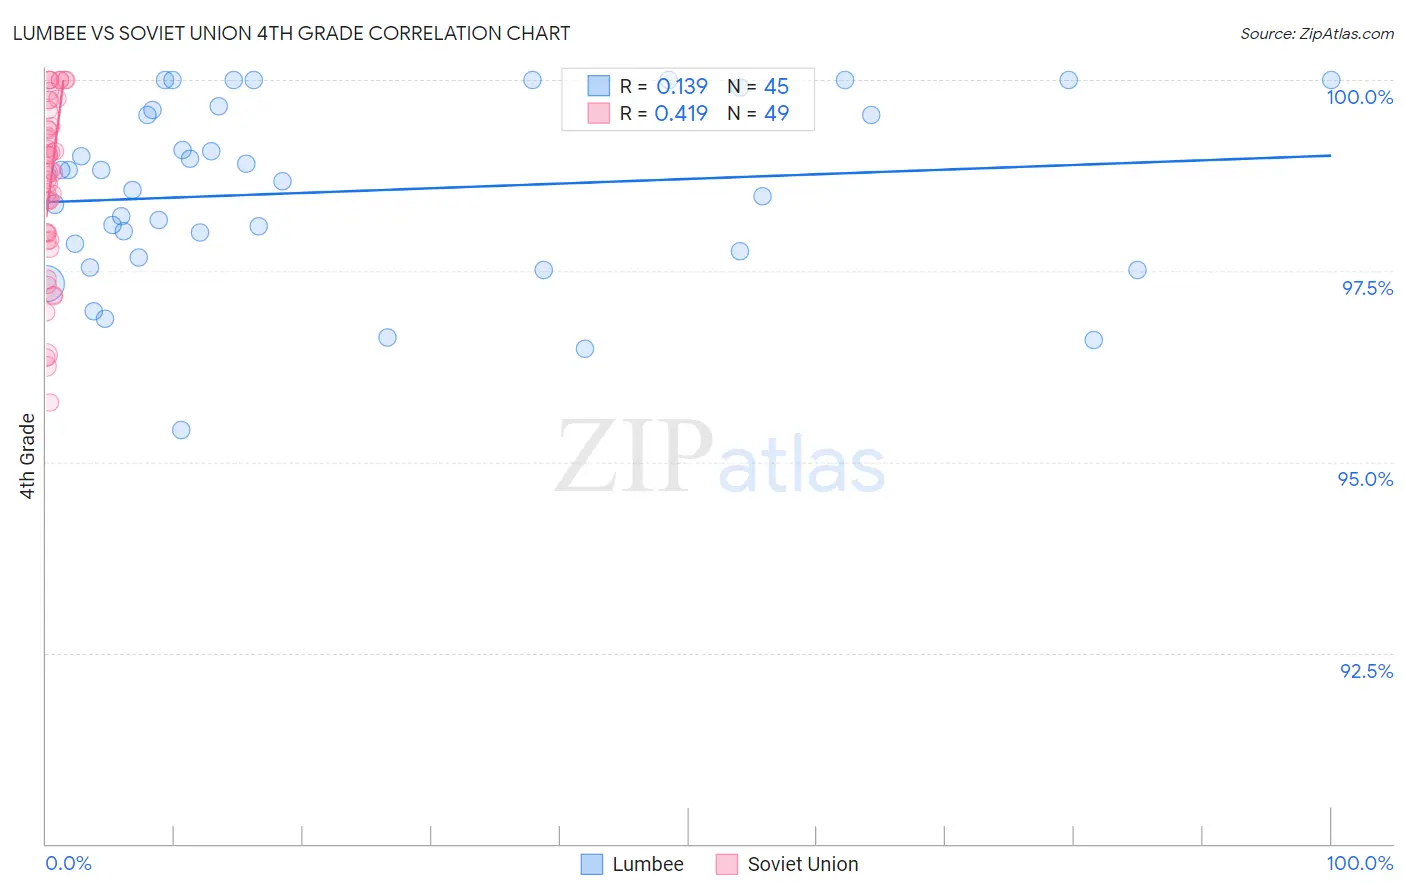
Lumbee vs Soviet Union 4th Grade Correlation Chart

The statistical analysis conducted on geographies consisting of 92,298,549 people shows a poor positive correlation between the proportion of Lumbee and percentage of population with at least 4th grade education in the United States with a correlation coefficient (R) of 0.139 and weighted average of 98.0%. Similarly, the statistical analysis conducted on geographies consisting of 43,454,395 people shows a moderate positive correlation between the proportion of Soviet Union and percentage of population with at least 4th grade education in the United States with a correlation coefficient (R) of 0.419 and weighted average of 97.6%, a difference of 0.40%.
Lumbee vs Soviet Union 4th Grade

4th Grade Correlation Summary

MeasurementLumbeeSoviet Union
Minimum95.4%95.8%
Maximum100.0%100.0%
Range4.6%4.2%
Mean98.5%98.6%
Median98.7%98.8%
Interquartile 25% (IQ1)97.7%97.9%
Interquartile 75% (IQ3)99.6%99.5%
Interquartile Range (IQR)1.9%1.6%
Standard Deviation (Sample)1.2%1.1%
Standard Deviation (Population)1.2%1.1%

Similar Demographics by 4th Grade

Demographics Similar to Lumbee by 4th Grade

In terms of 4th grade, the demographic groups most similar to Lumbee are Kiowa (98.0%, a difference of 0.0%), Pueblo (98.0%, a difference of 0.0%), Immigrants from Austria (98.0%, a difference of 0.0%), Immigrants from Northern Europe (98.0%, a difference of 0.010%), and Canadian (98.0%, a difference of 0.010%).
DemographicsRating | Rank4th Grade
Cajuns
99.7
/100
|
#64
Exceptional
98.0%
Immigrants | Northern Europe
99.6
/100
|
#65
Exceptional
98.0%
Canadians
99.6
/100
|
#66
Exceptional
98.0%
New Zealanders
99.6
/100
|
#67
Exceptional
98.0%
Kiowa
99.6
/100
|
#68
Exceptional
98.0%
Pueblo
99.6
/100
|
#69
Exceptional
98.0%
Immigrants | Austria
99.6
/100
|
#70
Exceptional
98.0%
Lumbee
99.6
/100
|
#71
Exceptional
98.0%
Iranians
99.4
/100
|
#72
Exceptional
98.0%
Macedonians
99.4
/100
|
#73
Exceptional
98.0%
Chickasaw
99.4
/100
|
#74
Exceptional
98.0%
Immigrants | Netherlands
99.3
/100
|
#75
Exceptional
98.0%
Cherokee
99.3
/100
|
#76
Exceptional
98.0%
Immigrants | Lithuania
99.3
/100
|
#77
Exceptional
98.0%
Immigrants | England
99.3
/100
|
#78
Exceptional
98.0%

Demographics Similar to Soviet Union by 4th Grade

In terms of 4th grade, the demographic groups most similar to Soviet Union are Immigrants from Israel (97.6%, a difference of 0.0%), Alsatian (97.6%, a difference of 0.0%), Immigrants from South Central Asia (97.6%, a difference of 0.010%), Jordanian (97.7%, a difference of 0.020%), and Ute (97.7%, a difference of 0.020%).
DemographicsRating | Rank4th Grade
Immigrants | North Macedonia
83.3
/100
|
#142
Excellent
97.7%
Burmese
82.8
/100
|
#143
Excellent
97.7%
Spaniards
82.7
/100
|
#144
Excellent
97.7%
Immigrants | Moldova
82.4
/100
|
#145
Excellent
97.7%
Jordanians
81.3
/100
|
#146
Excellent
97.7%
Ute
80.6
/100
|
#147
Excellent
97.7%
Hopi
80.6
/100
|
#148
Excellent
97.7%
Soviet Union
77.8
/100
|
#149
Good
97.6%
Immigrants | Israel
77.7
/100
|
#150
Good
97.6%
Alsatians
77.2
/100
|
#151
Good
97.6%
Immigrants | South Central Asia
76.2
/100
|
#152
Good
97.6%
Immigrants | Eastern Europe
71.3
/100
|
#153
Good
97.6%
Immigrants | Russia
67.0
/100
|
#154
Good
97.6%
Albanians
67.0
/100
|
#155
Good
97.6%
Immigrants | Jordan
66.9
/100
|
#156
Good
97.6%