Lumbee vs Armenian Doctorate Degree
COMPARE
Lumbee
Armenian
Doctorate Degree
Doctorate Degree Comparison
Lumbee
Armenians
1.1%
DOCTORATE DEGREE
0.0/ 100
METRIC RATING
345th/ 347
METRIC RANK
2.1%
DOCTORATE DEGREE
98.3/ 100
METRIC RATING
98th/ 347
METRIC RANK
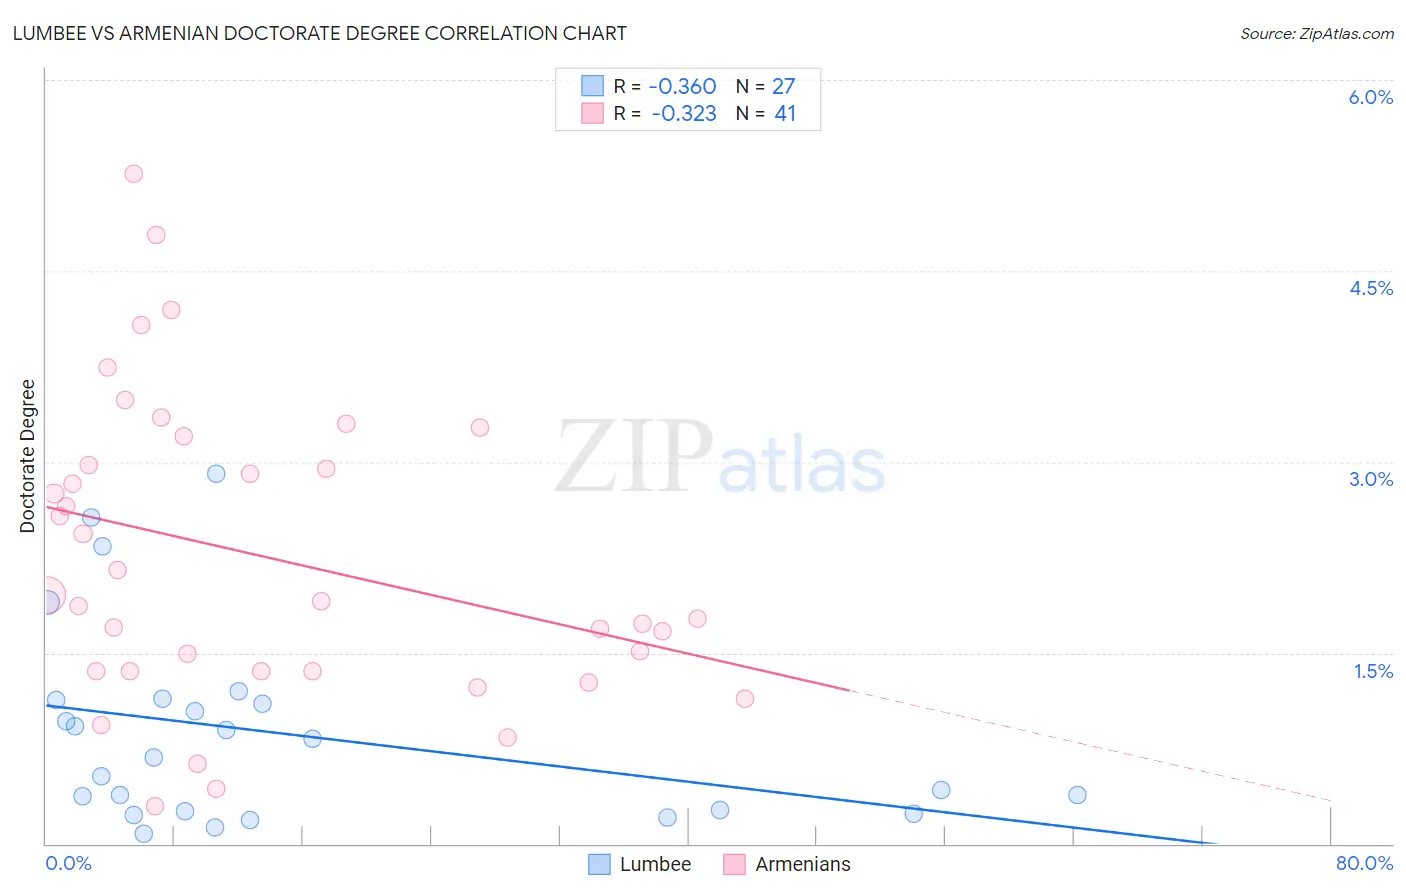
Lumbee vs Armenian Doctorate Degree Correlation Chart
The statistical analysis conducted on geographies consisting of 91,789,296 people shows a mild negative correlation between the proportion of Lumbee and percentage of population with at least doctorate degree education in the United States with a correlation coefficient (R) of -0.360 and weighted average of 1.1%. Similarly, the statistical analysis conducted on geographies consisting of 309,311,130 people shows a mild negative correlation between the proportion of Armenians and percentage of population with at least doctorate degree education in the United States with a correlation coefficient (R) of -0.323 and weighted average of 2.1%, a difference of 94.0%.
Doctorate Degree Correlation Summary
| Measurement | Lumbee | Armenian |
| Minimum | 0.076% | 0.29% |
| Maximum | 2.9% | 5.3% |
| Range | 2.8% | 5.0% |
| Mean | 0.86% | 2.3% |
| Median | 0.68% | 1.9% |
| Interquartile 25% (IQ1) | 0.26% | 1.4% |
| Interquartile 75% (IQ3) | 1.1% | 3.1% |
| Interquartile Range (IQR) | 0.87% | 1.7% |
| Standard Deviation (Sample) | 0.77% | 1.2% |
| Standard Deviation (Population) | 0.75% | 1.2% |
Similar Demographics by Doctorate Degree
Demographics Similar to Lumbee by Doctorate Degree
In terms of doctorate degree, the demographic groups most similar to Lumbee are Immigrants from Mexico (1.1%, a difference of 1.5%), Spanish American Indian (1.1%, a difference of 2.8%), Fijian (1.1%, a difference of 3.6%), Arapaho (1.2%, a difference of 7.1%), and Mexican (1.2%, a difference of 7.5%).
| Demographics | Rating | Rank | Doctorate Degree |
| Immigrants | Caribbean | 0.0 /100 | #333 | Tragic 1.3% |
| Immigrants | Dominican Republic | 0.0 /100 | #334 | Tragic 1.3% |
| Immigrants | Haiti | 0.0 /100 | #335 | Tragic 1.3% |
| Nepalese | 0.0 /100 | #336 | Tragic 1.3% |
| Bangladeshis | 0.0 /100 | #337 | Tragic 1.2% |
| Puget Sound Salish | 0.0 /100 | #338 | Tragic 1.2% |
| Immigrants | Central America | 0.0 /100 | #339 | Tragic 1.2% |
| Immigrants | Cuba | 0.0 /100 | #340 | Tragic 1.2% |
| Mexicans | 0.0 /100 | #341 | Tragic 1.2% |
| Arapaho | 0.0 /100 | #342 | Tragic 1.2% |
| Fijians | 0.0 /100 | #343 | Tragic 1.1% |
| Immigrants | Mexico | 0.0 /100 | #344 | Tragic 1.1% |
| Lumbee | 0.0 /100 | #345 | Tragic 1.1% |
| Spanish American Indians | 0.0 /100 | #346 | Tragic 1.1% |
| Houma | 0.0 /100 | #347 | Tragic 0.96% |
Demographics Similar to Armenians by Doctorate Degree
In terms of doctorate degree, the demographic groups most similar to Armenians are Immigrants from Eritrea (2.1%, a difference of 0.080%), Immigrants from Egypt (2.1%, a difference of 0.18%), Immigrants from Eastern Europe (2.1%, a difference of 0.18%), Immigrants from Northern Africa (2.1%, a difference of 0.21%), and Immigrants from Eastern Africa (2.1%, a difference of 0.21%).
| Demographics | Rating | Rank | Doctorate Degree |
| Immigrants | Sudan | 99.1 /100 | #91 | Exceptional 2.2% |
| Chileans | 99.1 /100 | #92 | Exceptional 2.2% |
| Alsatians | 99.0 /100 | #93 | Exceptional 2.1% |
| Greeks | 98.8 /100 | #94 | Exceptional 2.1% |
| Immigrants | Romania | 98.7 /100 | #95 | Exceptional 2.1% |
| Immigrants | Northern Africa | 98.4 /100 | #96 | Exceptional 2.1% |
| Immigrants | Eritrea | 98.4 /100 | #97 | Exceptional 2.1% |
| Armenians | 98.3 /100 | #98 | Exceptional 2.1% |
| Immigrants | Egypt | 98.2 /100 | #99 | Exceptional 2.1% |
| Immigrants | Eastern Europe | 98.2 /100 | #100 | Exceptional 2.1% |
| Immigrants | Eastern Africa | 98.2 /100 | #101 | Exceptional 2.1% |
| Immigrants | Chile | 98.1 /100 | #102 | Exceptional 2.1% |
| Romanians | 98.1 /100 | #103 | Exceptional 2.1% |
| Austrians | 98.0 /100 | #104 | Exceptional 2.1% |
| Arabs | 97.8 /100 | #105 | Exceptional 2.1% |