Lithuanian vs Uruguayan Master's Degree
COMPARE
Lithuanian
Uruguayan
Master's Degree
Master's Degree Comparison
Lithuanians
Uruguayans
17.7%
MASTER'S DEGREE
99.7/ 100
METRIC RATING
72nd/ 347
METRIC RANK
15.3%
MASTER'S DEGREE
67.1/ 100
METRIC RATING
163rd/ 347
METRIC RANK
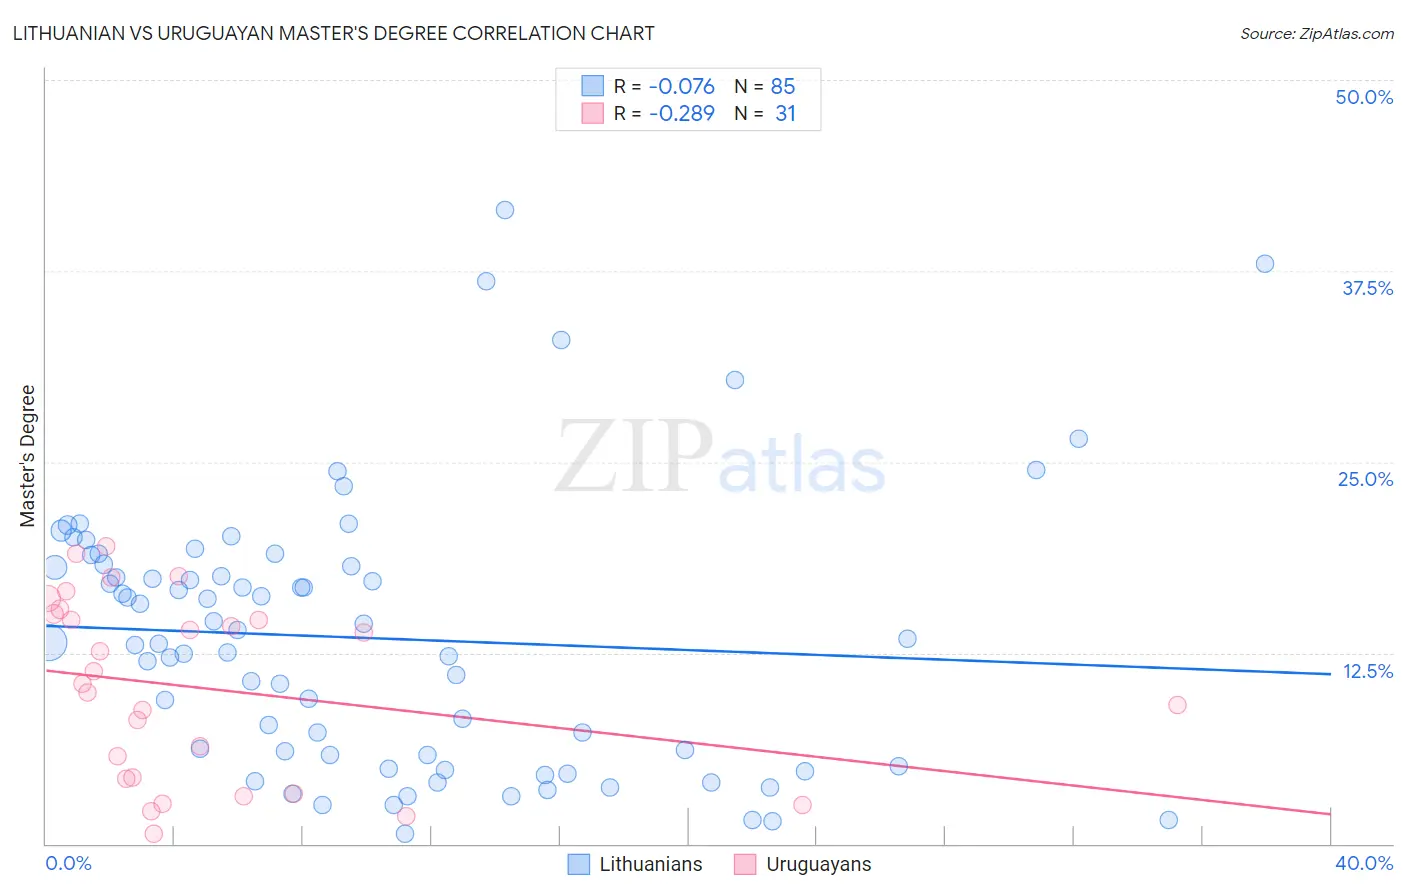
Lithuanian vs Uruguayan Master's Degree Correlation Chart
The statistical analysis conducted on geographies consisting of 421,813,641 people shows a slight negative correlation between the proportion of Lithuanians and percentage of population with at least master's degree education in the United States with a correlation coefficient (R) of -0.076 and weighted average of 17.7%. Similarly, the statistical analysis conducted on geographies consisting of 144,768,482 people shows a weak negative correlation between the proportion of Uruguayans and percentage of population with at least master's degree education in the United States with a correlation coefficient (R) of -0.289 and weighted average of 15.3%, a difference of 16.3%.
Master's Degree Correlation Summary
| Measurement | Lithuanian | Uruguayan |
| Minimum | 0.63% | 0.62% |
| Maximum | 41.5% | 19.5% |
| Range | 40.9% | 18.8% |
| Mean | 13.5% | 10.2% |
| Median | 13.2% | 10.5% |
| Interquartile 25% (IQ1) | 5.4% | 4.3% |
| Interquartile 75% (IQ3) | 18.2% | 15.1% |
| Interquartile Range (IQR) | 12.8% | 10.8% |
| Standard Deviation (Sample) | 8.8% | 5.9% |
| Standard Deviation (Population) | 8.7% | 5.8% |
Similar Demographics by Master's Degree
Demographics Similar to Lithuanians by Master's Degree
In terms of master's degree, the demographic groups most similar to Lithuanians are Zimbabwean (17.7%, a difference of 0.11%), Immigrants from Pakistan (17.8%, a difference of 0.17%), Immigrants from Romania (17.7%, a difference of 0.41%), Immigrants from Western Europe (17.8%, a difference of 0.46%), and Immigrants from Uzbekistan (17.9%, a difference of 0.67%).
| Demographics | Rating | Rank | Master's Degree |
| Immigrants | Kazakhstan | 99.8 /100 | #65 | Exceptional 18.0% |
| Ethiopians | 99.8 /100 | #66 | Exceptional 18.0% |
| Immigrants | Argentina | 99.8 /100 | #67 | Exceptional 18.0% |
| Immigrants | Ethiopia | 99.8 /100 | #68 | Exceptional 17.9% |
| Immigrants | Uzbekistan | 99.8 /100 | #69 | Exceptional 17.9% |
| Immigrants | Western Europe | 99.8 /100 | #70 | Exceptional 17.8% |
| Immigrants | Pakistan | 99.7 /100 | #71 | Exceptional 17.8% |
| Lithuanians | 99.7 /100 | #72 | Exceptional 17.7% |
| Zimbabweans | 99.7 /100 | #73 | Exceptional 17.7% |
| Immigrants | Romania | 99.7 /100 | #74 | Exceptional 17.7% |
| Egyptians | 99.6 /100 | #75 | Exceptional 17.6% |
| Immigrants | Indonesia | 99.6 /100 | #76 | Exceptional 17.6% |
| Immigrants | Eastern Europe | 99.6 /100 | #77 | Exceptional 17.6% |
| Immigrants | Hungary | 99.6 /100 | #78 | Exceptional 17.5% |
| Immigrants | Lebanon | 99.6 /100 | #79 | Exceptional 17.5% |
Demographics Similar to Uruguayans by Master's Degree
In terms of master's degree, the demographic groups most similar to Uruguayans are Colombian (15.3%, a difference of 0.030%), Immigrants from Kenya (15.3%, a difference of 0.070%), Swedish (15.2%, a difference of 0.14%), Senegalese (15.2%, a difference of 0.21%), and Peruvian (15.3%, a difference of 0.22%).
| Demographics | Rating | Rank | Master's Degree |
| Bermudans | 73.9 /100 | #156 | Good 15.4% |
| Immigrants | Cameroon | 71.7 /100 | #157 | Good 15.4% |
| Immigrants | Poland | 71.5 /100 | #158 | Good 15.4% |
| Luxembourgers | 71.0 /100 | #159 | Good 15.3% |
| Kenyans | 70.3 /100 | #160 | Good 15.3% |
| Sudanese | 68.7 /100 | #161 | Good 15.3% |
| Peruvians | 68.7 /100 | #162 | Good 15.3% |
| Uruguayans | 67.1 /100 | #163 | Good 15.3% |
| Colombians | 66.9 /100 | #164 | Good 15.3% |
| Immigrants | Kenya | 66.6 /100 | #165 | Good 15.3% |
| Swedes | 66.1 /100 | #166 | Good 15.2% |
| Senegalese | 65.6 /100 | #167 | Good 15.2% |
| Immigrants | North Macedonia | 64.5 /100 | #168 | Good 15.2% |
| Scottish | 62.7 /100 | #169 | Good 15.2% |
| Irish | 56.3 /100 | #170 | Average 15.0% |