Lithuanian vs Immigrants from Panama Doctorate Degree
COMPARE
Lithuanian
Immigrants from Panama
Doctorate Degree
Doctorate Degree Comparison
Lithuanians
Immigrants from Panama
2.3%
DOCTORATE DEGREE
99.8/ 100
METRIC RATING
70th/ 347
METRIC RANK
1.6%
DOCTORATE DEGREE
2.4/ 100
METRIC RATING
240th/ 347
METRIC RANK
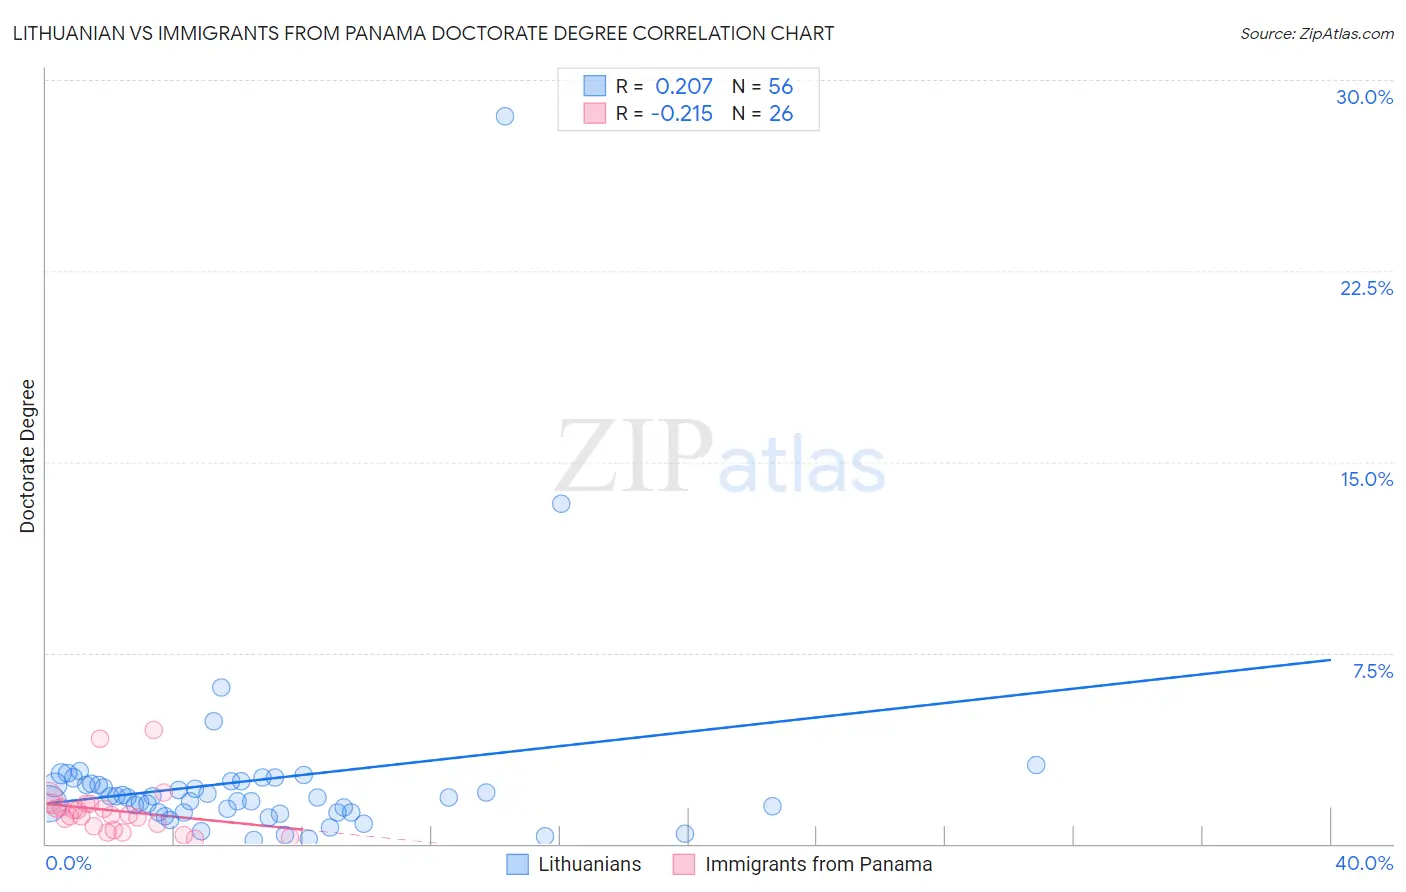
Lithuanian vs Immigrants from Panama Doctorate Degree Correlation Chart
The statistical analysis conducted on geographies consisting of 417,147,177 people shows a weak positive correlation between the proportion of Lithuanians and percentage of population with at least doctorate degree education in the United States with a correlation coefficient (R) of 0.207 and weighted average of 2.3%. Similarly, the statistical analysis conducted on geographies consisting of 220,111,742 people shows a weak negative correlation between the proportion of Immigrants from Panama and percentage of population with at least doctorate degree education in the United States with a correlation coefficient (R) of -0.215 and weighted average of 1.6%, a difference of 42.1%.
Doctorate Degree Correlation Summary
| Measurement | Lithuanian | Immigrants from Panama |
| Minimum | 0.13% | 0.20% |
| Maximum | 28.6% | 4.4% |
| Range | 28.4% | 4.2% |
| Mean | 2.5% | 1.3% |
| Median | 1.8% | 1.1% |
| Interquartile 25% (IQ1) | 1.2% | 0.67% |
| Interquartile 75% (IQ3) | 2.4% | 1.5% |
| Interquartile Range (IQR) | 1.2% | 0.88% |
| Standard Deviation (Sample) | 4.0% | 1.0% |
| Standard Deviation (Population) | 4.0% | 0.98% |
Similar Demographics by Doctorate Degree
Demographics Similar to Lithuanians by Doctorate Degree
In terms of doctorate degree, the demographic groups most similar to Lithuanians are Immigrants from Bolivia (2.3%, a difference of 0.0%), Carpatho Rusyn (2.3%, a difference of 0.14%), Immigrants from Canada (2.3%, a difference of 0.16%), Immigrants from Bulgaria (2.3%, a difference of 0.24%), and Immigrants from North America (2.2%, a difference of 0.38%).
| Demographics | Rating | Rank | Doctorate Degree |
| Laotians | 99.9 /100 | #63 | Exceptional 2.3% |
| Immigrants | Greece | 99.9 /100 | #64 | Exceptional 2.3% |
| Paraguayans | 99.9 /100 | #65 | Exceptional 2.3% |
| Argentineans | 99.9 /100 | #66 | Exceptional 2.3% |
| Zimbabweans | 99.8 /100 | #67 | Exceptional 2.3% |
| Immigrants | Kazakhstan | 99.8 /100 | #68 | Exceptional 2.3% |
| Carpatho Rusyns | 99.8 /100 | #69 | Exceptional 2.3% |
| Lithuanians | 99.8 /100 | #70 | Exceptional 2.3% |
| Immigrants | Bolivia | 99.8 /100 | #71 | Exceptional 2.3% |
| Immigrants | Canada | 99.8 /100 | #72 | Exceptional 2.3% |
| Immigrants | Bulgaria | 99.8 /100 | #73 | Exceptional 2.3% |
| Immigrants | North America | 99.8 /100 | #74 | Exceptional 2.2% |
| Immigrants | Western Asia | 99.8 /100 | #75 | Exceptional 2.2% |
| Immigrants | Hungary | 99.8 /100 | #76 | Exceptional 2.2% |
| Immigrants | Lebanon | 99.8 /100 | #77 | Exceptional 2.2% |
Demographics Similar to Immigrants from Panama by Doctorate Degree
In terms of doctorate degree, the demographic groups most similar to Immigrants from Panama are West Indian (1.6%, a difference of 0.19%), Cheyenne (1.6%, a difference of 0.19%), Immigrants from Congo (1.6%, a difference of 0.29%), Ottawa (1.6%, a difference of 0.40%), and Iroquois (1.6%, a difference of 0.50%).
| Demographics | Rating | Rank | Doctorate Degree |
| Barbadians | 3.3 /100 | #233 | Tragic 1.6% |
| Hopi | 3.2 /100 | #234 | Tragic 1.6% |
| Cree | 3.0 /100 | #235 | Tragic 1.6% |
| Indonesians | 2.8 /100 | #236 | Tragic 1.6% |
| Iroquois | 2.7 /100 | #237 | Tragic 1.6% |
| Immigrants | Congo | 2.6 /100 | #238 | Tragic 1.6% |
| West Indians | 2.5 /100 | #239 | Tragic 1.6% |
| Immigrants | Panama | 2.4 /100 | #240 | Tragic 1.6% |
| Cheyenne | 2.3 /100 | #241 | Tragic 1.6% |
| Ottawa | 2.2 /100 | #242 | Tragic 1.6% |
| Native Hawaiians | 2.1 /100 | #243 | Tragic 1.6% |
| French American Indians | 2.0 /100 | #244 | Tragic 1.6% |
| Delaware | 1.9 /100 | #245 | Tragic 1.6% |
| Hmong | 1.8 /100 | #246 | Tragic 1.6% |
| Comanche | 1.8 /100 | #247 | Tragic 1.6% |