Lithuanian vs Immigrants from Eritrea 12th Grade, No Diploma
COMPARE
Lithuanian
Immigrants from Eritrea
12th Grade, No Diploma
12th Grade, No Diploma Comparison
Lithuanians
Immigrants from Eritrea
93.6%
12TH GRADE, NO DIPLOMA
100.0/ 100
METRIC RATING
3rd/ 347
METRIC RANK
89.9%
12TH GRADE, NO DIPLOMA
1.0/ 100
METRIC RATING
250th/ 347
METRIC RANK
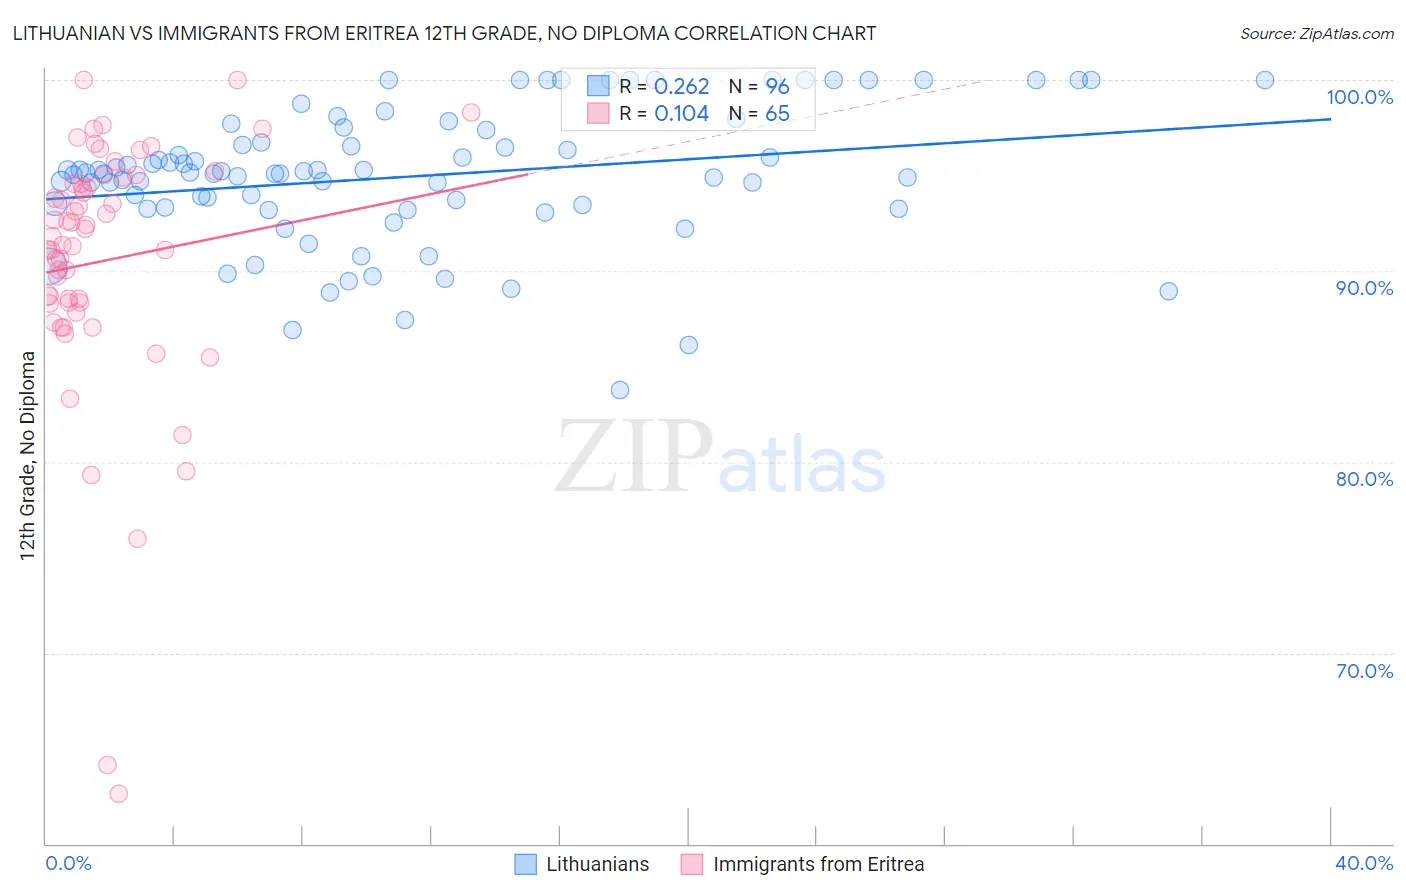
Lithuanian vs Immigrants from Eritrea 12th Grade, No Diploma Correlation Chart
The statistical analysis conducted on geographies consisting of 421,947,832 people shows a weak positive correlation between the proportion of Lithuanians and percentage of population with at least 12th grade (no diploma) education in the United States with a correlation coefficient (R) of 0.262 and weighted average of 93.6%. Similarly, the statistical analysis conducted on geographies consisting of 104,792,854 people shows a poor positive correlation between the proportion of Immigrants from Eritrea and percentage of population with at least 12th grade (no diploma) education in the United States with a correlation coefficient (R) of 0.104 and weighted average of 89.9%, a difference of 4.2%.
12th Grade, No Diploma Correlation Summary
| Measurement | Lithuanian | Immigrants from Eritrea |
| Minimum | 83.8% | 62.6% |
| Maximum | 100.0% | 100.0% |
| Range | 16.2% | 37.4% |
| Mean | 94.9% | 90.5% |
| Median | 95.1% | 91.8% |
| Interquartile 25% (IQ1) | 93.3% | 88.3% |
| Interquartile 75% (IQ3) | 97.1% | 94.7% |
| Interquartile Range (IQR) | 3.8% | 6.4% |
| Standard Deviation (Sample) | 3.5% | 6.9% |
| Standard Deviation (Population) | 3.5% | 6.8% |
Similar Demographics by 12th Grade, No Diploma
Demographics Similar to Lithuanians by 12th Grade, No Diploma
In terms of 12th grade, no diploma, the demographic groups most similar to Lithuanians are Slovene (93.6%, a difference of 0.010%), Carpatho Rusyn (93.6%, a difference of 0.020%), Immigrants from India (93.6%, a difference of 0.030%), Slovak (93.6%, a difference of 0.070%), and Chinese (93.6%, a difference of 0.070%).
| Demographics | Rating | Rank | 12th Grade, No Diploma |
| Norwegians | 100.0 /100 | #1 | Exceptional 94.0% |
| Swedes | 100.0 /100 | #2 | Exceptional 93.7% |
| Lithuanians | 100.0 /100 | #3 | Exceptional 93.6% |
| Slovenes | 100.0 /100 | #4 | Exceptional 93.6% |
| Carpatho Rusyns | 100.0 /100 | #5 | Exceptional 93.6% |
| Immigrants | India | 100.0 /100 | #6 | Exceptional 93.6% |
| Slovaks | 100.0 /100 | #7 | Exceptional 93.6% |
| Chinese | 100.0 /100 | #8 | Exceptional 93.6% |
| Latvians | 100.0 /100 | #9 | Exceptional 93.6% |
| Croatians | 100.0 /100 | #10 | Exceptional 93.5% |
| Poles | 100.0 /100 | #11 | Exceptional 93.5% |
| Eastern Europeans | 100.0 /100 | #12 | Exceptional 93.5% |
| Danes | 100.0 /100 | #13 | Exceptional 93.5% |
| Bulgarians | 100.0 /100 | #14 | Exceptional 93.5% |
| Finns | 100.0 /100 | #15 | Exceptional 93.4% |
Demographics Similar to Immigrants from Eritrea by 12th Grade, No Diploma
In terms of 12th grade, no diploma, the demographic groups most similar to Immigrants from Eritrea are Spanish American (89.9%, a difference of 0.010%), Bahamian (89.9%, a difference of 0.010%), Comanche (89.9%, a difference of 0.030%), Senegalese (89.9%, a difference of 0.030%), and Immigrants from Nigeria (89.9%, a difference of 0.090%).
| Demographics | Rating | Rank | 12th Grade, No Diploma |
| Crow | 1.5 /100 | #243 | Tragic 90.0% |
| Taiwanese | 1.5 /100 | #244 | Tragic 90.0% |
| Immigrants | Uruguay | 1.4 /100 | #245 | Tragic 90.0% |
| Ghanaians | 1.3 /100 | #246 | Tragic 90.0% |
| Immigrants | Nigeria | 1.3 /100 | #247 | Tragic 89.9% |
| Comanche | 1.1 /100 | #248 | Tragic 89.9% |
| Senegalese | 1.1 /100 | #249 | Tragic 89.9% |
| Immigrants | Eritrea | 1.0 /100 | #250 | Tragic 89.9% |
| Spanish Americans | 0.9 /100 | #251 | Tragic 89.9% |
| Bahamians | 0.9 /100 | #252 | Tragic 89.9% |
| Choctaw | 0.7 /100 | #253 | Tragic 89.8% |
| Immigrants | Peru | 0.5 /100 | #254 | Tragic 89.7% |
| Immigrants | Senegal | 0.5 /100 | #255 | Tragic 89.7% |
| Immigrants | Ghana | 0.5 /100 | #256 | Tragic 89.7% |
| Jamaicans | 0.5 /100 | #257 | Tragic 89.7% |