Liberian vs Immigrants from Hong Kong 8th Grade
COMPARE
Liberian
Immigrants from Hong Kong
8th Grade
8th Grade Comparison
Liberians
Immigrants from Hong Kong
95.6%
8TH GRADE
32.4/ 100
METRIC RATING
188th/ 347
METRIC RANK
94.9%
8TH GRADE
0.4/ 100
METRIC RATING
263rd/ 347
METRIC RANK
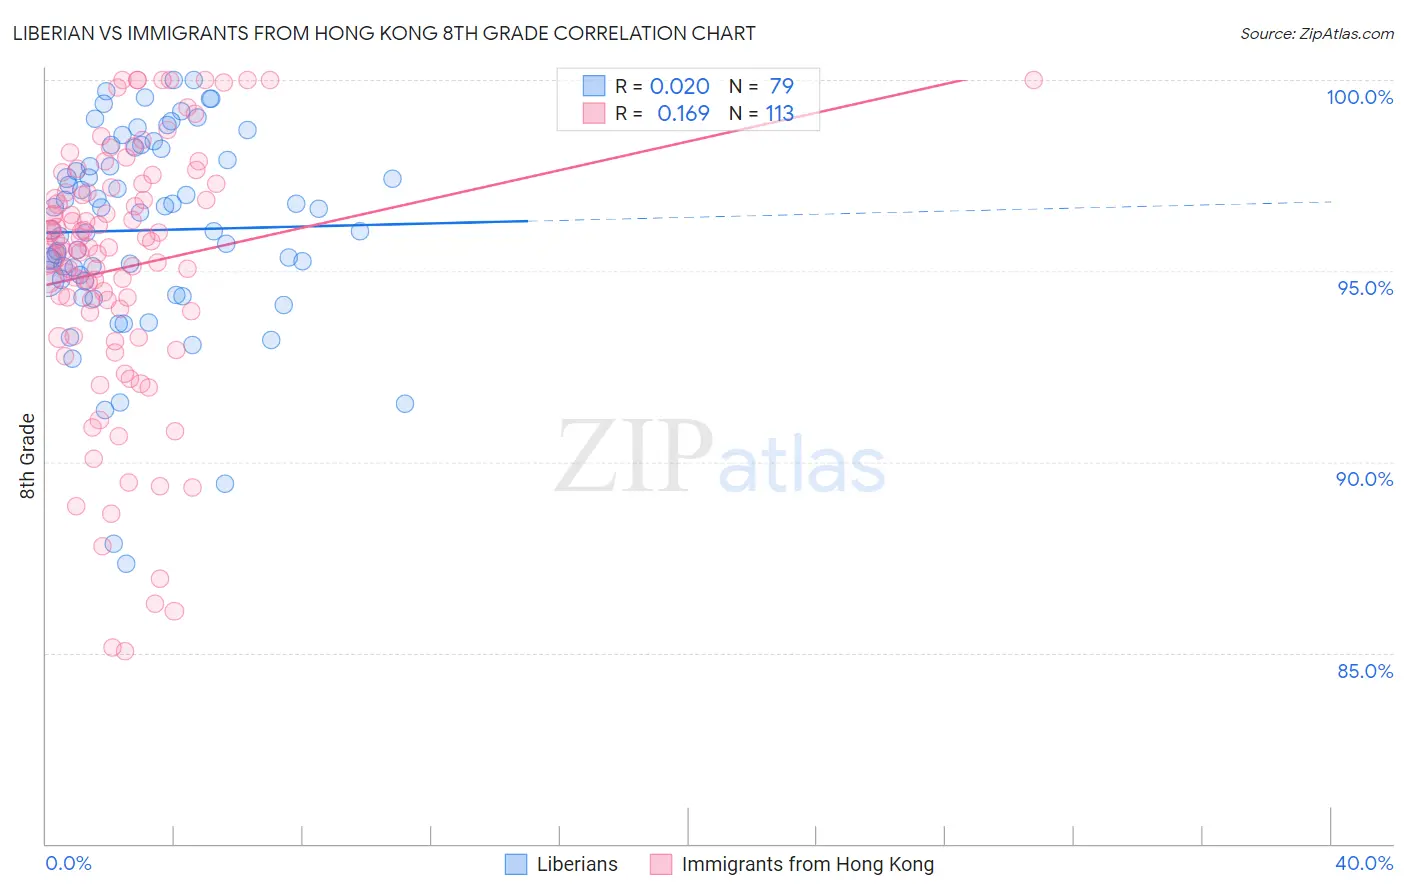
Liberian vs Immigrants from Hong Kong 8th Grade Correlation Chart
The statistical analysis conducted on geographies consisting of 118,101,800 people shows no correlation between the proportion of Liberians and percentage of population with at least 8th grade education in the United States with a correlation coefficient (R) of 0.020 and weighted average of 95.6%. Similarly, the statistical analysis conducted on geographies consisting of 253,990,382 people shows a poor positive correlation between the proportion of Immigrants from Hong Kong and percentage of population with at least 8th grade education in the United States with a correlation coefficient (R) of 0.169 and weighted average of 94.9%, a difference of 0.78%.
8th Grade Correlation Summary
| Measurement | Liberian | Immigrants from Hong Kong |
| Minimum | 87.3% | 85.0% |
| Maximum | 100.0% | 100.0% |
| Range | 12.7% | 15.0% |
| Mean | 96.1% | 95.1% |
| Median | 96.5% | 95.6% |
| Interquartile 25% (IQ1) | 94.8% | 93.6% |
| Interquartile 75% (IQ3) | 98.2% | 97.2% |
| Interquartile Range (IQR) | 3.4% | 3.6% |
| Standard Deviation (Sample) | 2.6% | 3.4% |
| Standard Deviation (Population) | 2.6% | 3.4% |
Similar Demographics by 8th Grade
Demographics Similar to Liberians by 8th Grade
In terms of 8th grade, the demographic groups most similar to Liberians are Sudanese (95.6%, a difference of 0.0%), Immigrants from Micronesia (95.6%, a difference of 0.010%), Immigrants from Venezuela (95.6%, a difference of 0.010%), Black/African American (95.6%, a difference of 0.020%), and Brazilian (95.6%, a difference of 0.020%).
| Demographics | Rating | Rank | 8th Grade |
| Immigrants | Spain | 38.7 /100 | #181 | Fair 95.7% |
| Immigrants | Egypt | 37.9 /100 | #182 | Fair 95.7% |
| Immigrants | Iraq | 36.2 /100 | #183 | Fair 95.6% |
| Immigrants | Uganda | 36.0 /100 | #184 | Fair 95.6% |
| Blacks/African Americans | 34.8 /100 | #185 | Fair 95.6% |
| Brazilians | 34.8 /100 | #186 | Fair 95.6% |
| Sudanese | 33.0 /100 | #187 | Fair 95.6% |
| Liberians | 32.4 /100 | #188 | Fair 95.6% |
| Immigrants | Micronesia | 31.6 /100 | #189 | Fair 95.6% |
| Immigrants | Venezuela | 30.8 /100 | #190 | Fair 95.6% |
| Immigrants | Nepal | 30.2 /100 | #191 | Fair 95.6% |
| Pima | 28.6 /100 | #192 | Fair 95.6% |
| Panamanians | 28.4 /100 | #193 | Fair 95.6% |
| Guamanians/Chamorros | 26.6 /100 | #194 | Fair 95.6% |
| Immigrants | Zaire | 25.2 /100 | #195 | Fair 95.6% |
Demographics Similar to Immigrants from Hong Kong by 8th Grade
In terms of 8th grade, the demographic groups most similar to Immigrants from Hong Kong are South American (94.9%, a difference of 0.0%), Immigrants from Nigeria (94.9%, a difference of 0.010%), Yuman (94.9%, a difference of 0.010%), Immigrants from Costa Rica (94.9%, a difference of 0.020%), and West Indian (94.8%, a difference of 0.050%).
| Demographics | Rating | Rank | 8th Grade |
| Colombians | 0.7 /100 | #256 | Tragic 95.0% |
| Afghans | 0.6 /100 | #257 | Tragic 94.9% |
| Immigrants | Congo | 0.6 /100 | #258 | Tragic 94.9% |
| Ghanaians | 0.6 /100 | #259 | Tragic 94.9% |
| Immigrants | Jamaica | 0.6 /100 | #260 | Tragic 94.9% |
| Immigrants | Costa Rica | 0.5 /100 | #261 | Tragic 94.9% |
| Immigrants | Nigeria | 0.4 /100 | #262 | Tragic 94.9% |
| Immigrants | Hong Kong | 0.4 /100 | #263 | Tragic 94.9% |
| South Americans | 0.4 /100 | #264 | Tragic 94.9% |
| Yuman | 0.4 /100 | #265 | Tragic 94.9% |
| West Indians | 0.3 /100 | #266 | Tragic 94.8% |
| Immigrants | Ghana | 0.3 /100 | #267 | Tragic 94.8% |
| Immigrants | Uruguay | 0.3 /100 | #268 | Tragic 94.8% |
| Immigrants | Thailand | 0.2 /100 | #269 | Tragic 94.8% |
| Immigrants | Uzbekistan | 0.2 /100 | #270 | Tragic 94.8% |