Liberian vs Immigrants from Ethiopia 7th Grade
COMPARE
Liberian
Immigrants from Ethiopia
7th Grade
7th Grade Comparison
Liberians
Immigrants from Ethiopia
95.9%
7TH GRADE
32.5/ 100
METRIC RATING
191st/ 347
METRIC RANK
95.3%
7TH GRADE
0.9/ 100
METRIC RATING
252nd/ 347
METRIC RANK
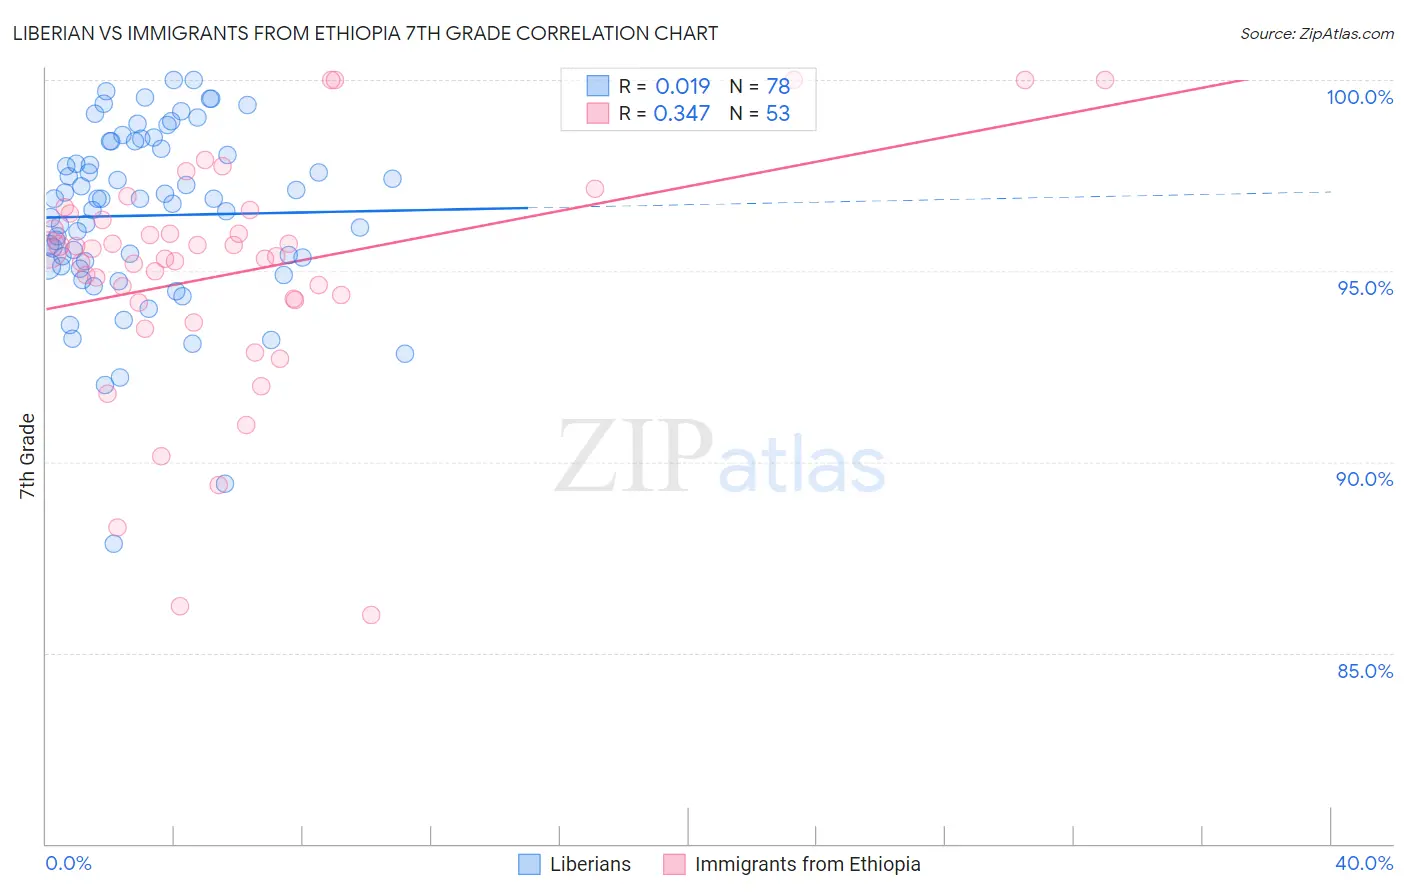
Liberian vs Immigrants from Ethiopia 7th Grade Correlation Chart
The statistical analysis conducted on geographies consisting of 118,089,001 people shows no correlation between the proportion of Liberians and percentage of population with at least 7th grade education in the United States with a correlation coefficient (R) of 0.019 and weighted average of 95.9%. Similarly, the statistical analysis conducted on geographies consisting of 211,528,629 people shows a mild positive correlation between the proportion of Immigrants from Ethiopia and percentage of population with at least 7th grade education in the United States with a correlation coefficient (R) of 0.347 and weighted average of 95.3%, a difference of 0.61%.
7th Grade Correlation Summary
| Measurement | Liberian | Immigrants from Ethiopia |
| Minimum | 87.9% | 86.0% |
| Maximum | 100.0% | 100.0% |
| Range | 12.1% | 14.0% |
| Mean | 96.5% | 95.0% |
| Median | 96.9% | 95.4% |
| Interquartile 25% (IQ1) | 95.1% | 94.2% |
| Interquartile 75% (IQ3) | 98.4% | 96.4% |
| Interquartile Range (IQR) | 3.3% | 2.2% |
| Standard Deviation (Sample) | 2.4% | 3.0% |
| Standard Deviation (Population) | 2.3% | 3.0% |
Similar Demographics by 7th Grade
Demographics Similar to Liberians by 7th Grade
In terms of 7th grade, the demographic groups most similar to Liberians are Immigrants from Micronesia (95.9%, a difference of 0.0%), Panamanian (95.9%, a difference of 0.0%), Immigrants from Egypt (95.9%, a difference of 0.010%), Immigrants from Venezuela (95.9%, a difference of 0.010%), and Immigrants from Bahamas (95.9%, a difference of 0.010%).
| Demographics | Rating | Rank | 7th Grade |
| Sierra Leoneans | 37.5 /100 | #184 | Fair 96.0% |
| Brazilians | 37.3 /100 | #185 | Fair 96.0% |
| Immigrants | Iraq | 36.1 /100 | #186 | Fair 96.0% |
| Immigrants | Uganda | 36.0 /100 | #187 | Fair 96.0% |
| Immigrants | Egypt | 34.3 /100 | #188 | Fair 95.9% |
| Immigrants | Venezuela | 33.9 /100 | #189 | Fair 95.9% |
| Immigrants | Micronesia | 32.6 /100 | #190 | Fair 95.9% |
| Liberians | 32.5 /100 | #191 | Fair 95.9% |
| Panamanians | 32.3 /100 | #192 | Fair 95.9% |
| Immigrants | Bahamas | 30.8 /100 | #193 | Fair 95.9% |
| Immigrants | Nepal | 30.0 /100 | #194 | Fair 95.9% |
| Sudanese | 28.1 /100 | #195 | Fair 95.9% |
| Apache | 27.6 /100 | #196 | Fair 95.9% |
| Immigrants | Zaire | 26.7 /100 | #197 | Fair 95.9% |
| Paraguayans | 24.8 /100 | #198 | Fair 95.9% |
Demographics Similar to Immigrants from Ethiopia by 7th Grade
In terms of 7th grade, the demographic groups most similar to Immigrants from Ethiopia are Immigrants from Cameroon (95.4%, a difference of 0.0%), Immigrants from Jamaica (95.4%, a difference of 0.0%), Somali (95.3%, a difference of 0.010%), Colombian (95.3%, a difference of 0.020%), and Paiute (95.4%, a difference of 0.030%).
| Demographics | Rating | Rank | 7th Grade |
| Immigrants | Middle Africa | 1.5 /100 | #245 | Tragic 95.4% |
| Ethiopians | 1.5 /100 | #246 | Tragic 95.4% |
| Tongans | 1.3 /100 | #247 | Tragic 95.4% |
| Paiute | 1.2 /100 | #248 | Tragic 95.4% |
| Bolivians | 1.1 /100 | #249 | Tragic 95.4% |
| Immigrants | Cameroon | 0.9 /100 | #250 | Tragic 95.4% |
| Immigrants | Jamaica | 0.9 /100 | #251 | Tragic 95.4% |
| Immigrants | Ethiopia | 0.9 /100 | #252 | Tragic 95.3% |
| Somalis | 0.9 /100 | #253 | Tragic 95.3% |
| Colombians | 0.8 /100 | #254 | Tragic 95.3% |
| Koreans | 0.8 /100 | #255 | Tragic 95.3% |
| Immigrants | China | 0.7 /100 | #256 | Tragic 95.3% |
| Immigrants | Congo | 0.7 /100 | #257 | Tragic 95.3% |
| Ghanaians | 0.7 /100 | #258 | Tragic 95.3% |
| Immigrants | Costa Rica | 0.6 /100 | #259 | Tragic 95.3% |