Liberian vs Immigrants from Czechoslovakia Master's Degree
COMPARE
Liberian
Immigrants from Czechoslovakia
Master's Degree
Master's Degree Comparison
Liberians
Immigrants from Czechoslovakia
12.8%
MASTER'S DEGREE
1.3/ 100
METRIC RATING
250th/ 347
METRIC RANK
18.5%
MASTER'S DEGREE
99.9/ 100
METRIC RATING
53rd/ 347
METRIC RANK
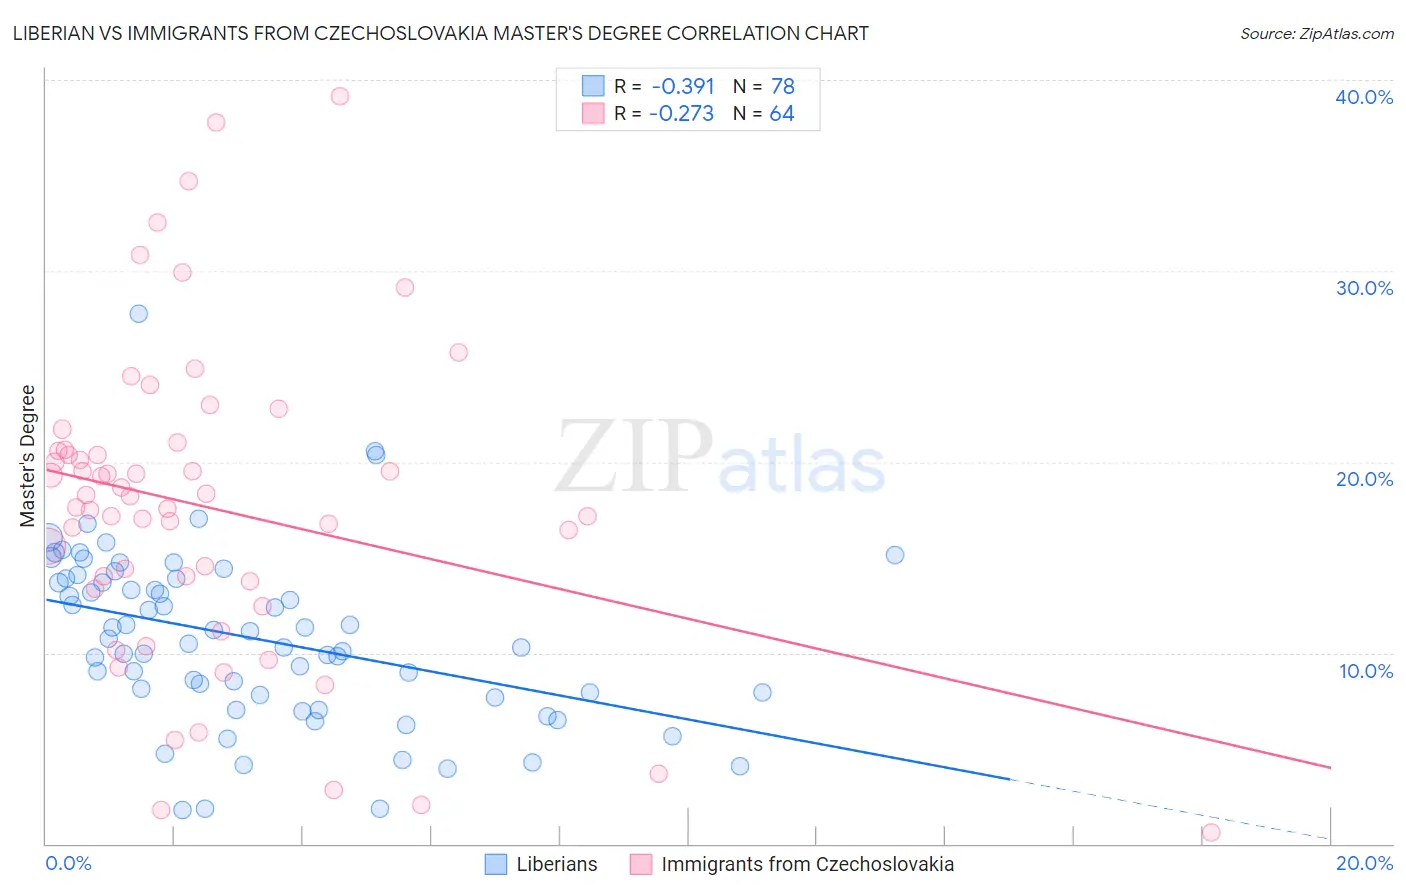
Liberian vs Immigrants from Czechoslovakia Master's Degree Correlation Chart
The statistical analysis conducted on geographies consisting of 118,041,824 people shows a mild negative correlation between the proportion of Liberians and percentage of population with at least master's degree education in the United States with a correlation coefficient (R) of -0.391 and weighted average of 12.8%. Similarly, the statistical analysis conducted on geographies consisting of 195,445,199 people shows a weak negative correlation between the proportion of Immigrants from Czechoslovakia and percentage of population with at least master's degree education in the United States with a correlation coefficient (R) of -0.273 and weighted average of 18.5%, a difference of 44.4%.
Master's Degree Correlation Summary
| Measurement | Liberian | Immigrants from Czechoslovakia |
| Minimum | 1.7% | 0.60% |
| Maximum | 27.8% | 39.2% |
| Range | 26.0% | 38.6% |
| Mean | 10.8% | 17.6% |
| Median | 10.6% | 17.9% |
| Interquartile 25% (IQ1) | 7.8% | 13.6% |
| Interquartile 75% (IQ3) | 13.9% | 20.6% |
| Interquartile Range (IQR) | 6.1% | 7.0% |
| Standard Deviation (Sample) | 4.6% | 8.2% |
| Standard Deviation (Population) | 4.5% | 8.1% |
Similar Demographics by Master's Degree
Demographics Similar to Liberians by Master's Degree
In terms of master's degree, the demographic groups most similar to Liberians are Cree (12.8%, a difference of 0.010%), Tlingit-Haida (12.8%, a difference of 0.030%), African (12.9%, a difference of 0.32%), Iroquois (12.9%, a difference of 0.40%), and Immigrants from Cambodia (12.9%, a difference of 0.44%).
| Demographics | Rating | Rank | Master's Degree |
| Immigrants | Jamaica | 1.9 /100 | #243 | Tragic 13.0% |
| Delaware | 1.7 /100 | #244 | Tragic 13.0% |
| Immigrants | Bahamas | 1.4 /100 | #245 | Tragic 12.9% |
| Immigrants | Cambodia | 1.4 /100 | #246 | Tragic 12.9% |
| Iroquois | 1.4 /100 | #247 | Tragic 12.9% |
| Africans | 1.4 /100 | #248 | Tragic 12.9% |
| Cree | 1.3 /100 | #249 | Tragic 12.8% |
| Liberians | 1.3 /100 | #250 | Tragic 12.8% |
| Tlingit-Haida | 1.3 /100 | #251 | Tragic 12.8% |
| French American Indians | 1.0 /100 | #252 | Tragic 12.7% |
| Immigrants | Dominica | 0.8 /100 | #253 | Tragic 12.6% |
| Indonesians | 0.8 /100 | #254 | Tragic 12.6% |
| Immigrants | Congo | 0.8 /100 | #255 | Tragic 12.6% |
| Immigrants | Portugal | 0.8 /100 | #256 | Tragic 12.6% |
| Osage | 0.7 /100 | #257 | Tragic 12.6% |
Demographics Similar to Immigrants from Czechoslovakia by Master's Degree
In terms of master's degree, the demographic groups most similar to Immigrants from Czechoslovakia are Immigrants from Kuwait (18.6%, a difference of 0.080%), Immigrants from Lithuania (18.5%, a difference of 0.31%), Immigrants from Serbia (18.5%, a difference of 0.34%), Asian (18.4%, a difference of 0.57%), and Immigrants from Asia (18.4%, a difference of 0.70%).
| Demographics | Rating | Rank | Master's Degree |
| Immigrants | Norway | 100.0 /100 | #46 | Exceptional 18.8% |
| Immigrants | Austria | 100.0 /100 | #47 | Exceptional 18.8% |
| Paraguayans | 100.0 /100 | #48 | Exceptional 18.8% |
| Estonians | 100.0 /100 | #49 | Exceptional 18.8% |
| Bulgarians | 100.0 /100 | #50 | Exceptional 18.8% |
| Immigrants | South Africa | 100.0 /100 | #51 | Exceptional 18.8% |
| Immigrants | Kuwait | 100.0 /100 | #52 | Exceptional 18.6% |
| Immigrants | Czechoslovakia | 99.9 /100 | #53 | Exceptional 18.5% |
| Immigrants | Lithuania | 99.9 /100 | #54 | Exceptional 18.5% |
| Immigrants | Serbia | 99.9 /100 | #55 | Exceptional 18.5% |
| Asians | 99.9 /100 | #56 | Exceptional 18.4% |
| Immigrants | Asia | 99.9 /100 | #57 | Exceptional 18.4% |
| Australians | 99.9 /100 | #58 | Exceptional 18.4% |
| Immigrants | Bulgaria | 99.9 /100 | #59 | Exceptional 18.3% |
| New Zealanders | 99.9 /100 | #60 | Exceptional 18.3% |