Lebanese vs Indian (Asian) Associate's Degree
COMPARE
Lebanese
Indian (Asian)
Associate's Degree
Associate's Degree Comparison
Lebanese
Indians (Asian)
48.8%
ASSOCIATE'S DEGREE
94.6/ 100
METRIC RATING
119th/ 347
METRIC RANK
54.8%
ASSOCIATE'S DEGREE
100.0/ 100
METRIC RATING
18th/ 347
METRIC RANK
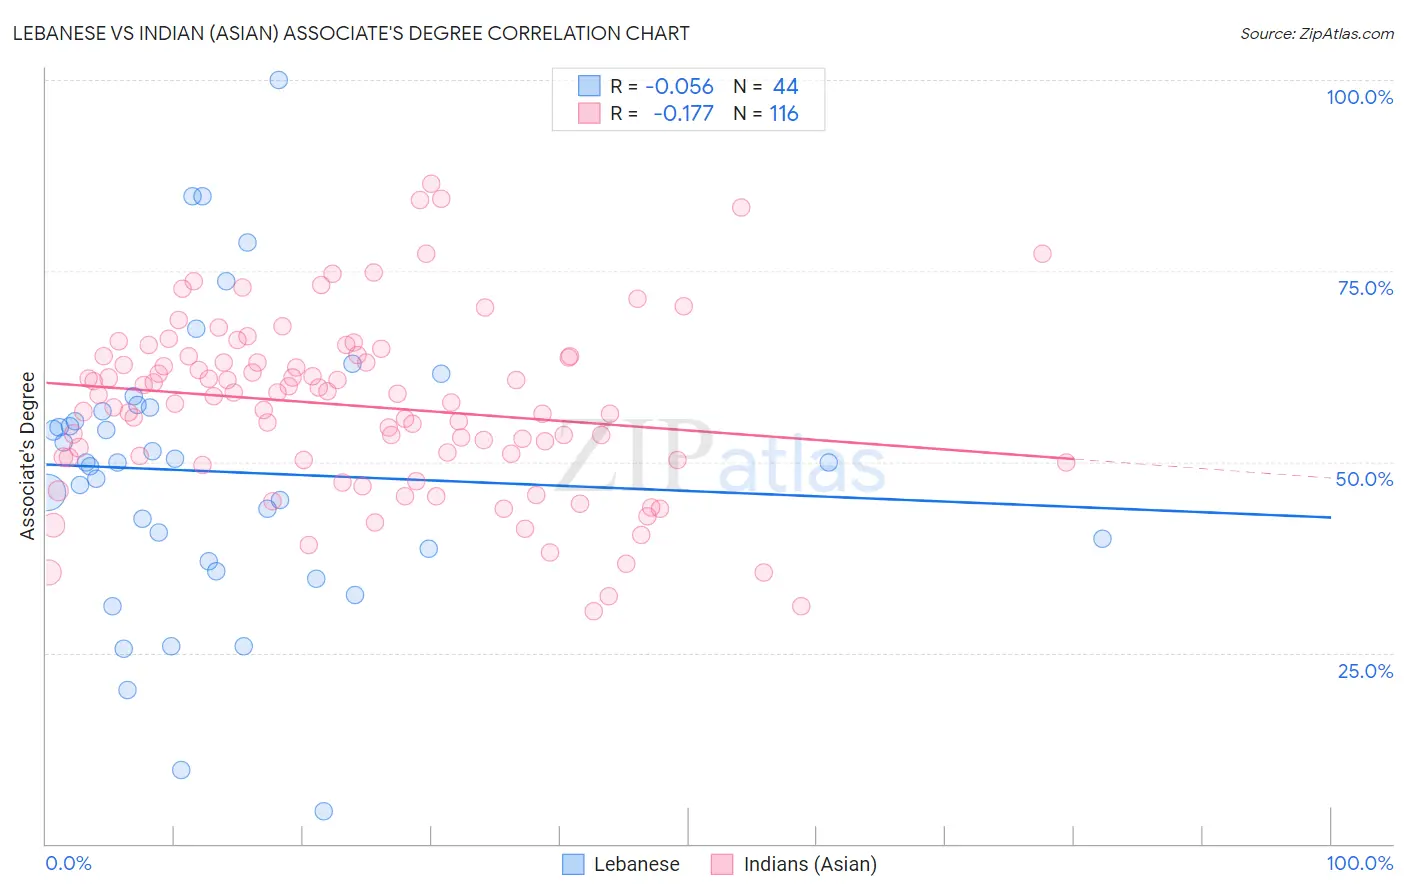
Lebanese vs Indian (Asian) Associate's Degree Correlation Chart
The statistical analysis conducted on geographies consisting of 401,605,631 people shows a slight negative correlation between the proportion of Lebanese and percentage of population with at least associate's degree education in the United States with a correlation coefficient (R) of -0.056 and weighted average of 48.8%. Similarly, the statistical analysis conducted on geographies consisting of 495,274,508 people shows a poor negative correlation between the proportion of Indians (Asian) and percentage of population with at least associate's degree education in the United States with a correlation coefficient (R) of -0.177 and weighted average of 54.8%, a difference of 12.2%.
Associate's Degree Correlation Summary
| Measurement | Lebanese | Indian (Asian) |
| Minimum | 4.3% | 30.4% |
| Maximum | 100.0% | 86.5% |
| Range | 95.7% | 56.1% |
| Mean | 48.7% | 57.3% |
| Median | 49.9% | 58.6% |
| Interquartile 25% (IQ1) | 37.8% | 50.4% |
| Interquartile 75% (IQ3) | 56.9% | 63.9% |
| Interquartile Range (IQR) | 19.1% | 13.4% |
| Standard Deviation (Sample) | 18.8% | 11.5% |
| Standard Deviation (Population) | 18.6% | 11.4% |
Similar Demographics by Associate's Degree
Demographics Similar to Lebanese by Associate's Degree
In terms of associate's degree, the demographic groups most similar to Lebanese are Albanian (48.8%, a difference of 0.010%), Alsatian (48.8%, a difference of 0.020%), Afghan (48.9%, a difference of 0.070%), British (48.9%, a difference of 0.12%), and Luxembourger (48.9%, a difference of 0.18%).
| Demographics | Rating | Rank | Associate's Degree |
| Immigrants | Chile | 95.3 /100 | #112 | Exceptional 49.0% |
| Palestinians | 95.3 /100 | #113 | Exceptional 49.0% |
| Arabs | 95.3 /100 | #114 | Exceptional 49.0% |
| Luxembourgers | 95.1 /100 | #115 | Exceptional 48.9% |
| British | 95.0 /100 | #116 | Exceptional 48.9% |
| Afghans | 94.8 /100 | #117 | Exceptional 48.9% |
| Albanians | 94.7 /100 | #118 | Exceptional 48.8% |
| Lebanese | 94.6 /100 | #119 | Exceptional 48.8% |
| Alsatians | 94.6 /100 | #120 | Exceptional 48.8% |
| Ugandans | 93.9 /100 | #121 | Exceptional 48.7% |
| Italians | 93.9 /100 | #122 | Exceptional 48.7% |
| Brazilians | 93.7 /100 | #123 | Exceptional 48.7% |
| Serbians | 92.6 /100 | #124 | Exceptional 48.5% |
| Chinese | 92.5 /100 | #125 | Exceptional 48.5% |
| Immigrants | Syria | 92.2 /100 | #126 | Exceptional 48.5% |
Demographics Similar to Indians (Asian) by Associate's Degree
In terms of associate's degree, the demographic groups most similar to Indians (Asian) are Immigrants from Ireland (54.7%, a difference of 0.22%), Cambodian (54.6%, a difference of 0.24%), Immigrants from Sweden (54.6%, a difference of 0.31%), Immigrants from Japan (54.6%, a difference of 0.34%), and Burmese (54.6%, a difference of 0.34%).
| Demographics | Rating | Rank | Associate's Degree |
| Immigrants | Australia | 100.0 /100 | #11 | Exceptional 55.8% |
| Immigrants | South Central Asia | 100.0 /100 | #12 | Exceptional 55.7% |
| Immigrants | China | 100.0 /100 | #13 | Exceptional 55.5% |
| Immigrants | Hong Kong | 100.0 /100 | #14 | Exceptional 55.4% |
| Immigrants | Eastern Asia | 100.0 /100 | #15 | Exceptional 55.4% |
| Soviet Union | 100.0 /100 | #16 | Exceptional 55.1% |
| Eastern Europeans | 100.0 /100 | #17 | Exceptional 55.0% |
| Indians (Asian) | 100.0 /100 | #18 | Exceptional 54.8% |
| Immigrants | Ireland | 100.0 /100 | #19 | Exceptional 54.7% |
| Cambodians | 100.0 /100 | #20 | Exceptional 54.6% |
| Immigrants | Sweden | 100.0 /100 | #21 | Exceptional 54.6% |
| Immigrants | Japan | 100.0 /100 | #22 | Exceptional 54.6% |
| Burmese | 100.0 /100 | #23 | Exceptional 54.6% |
| Immigrants | Korea | 100.0 /100 | #24 | Exceptional 54.5% |
| Immigrants | Switzerland | 100.0 /100 | #25 | Exceptional 54.5% |