Lebanese vs Immigrants from Eastern Asia Kindergarten

COMPARE

Lebanese
Race
Ancestry
AfghanAfricanAlaska NativeAlaskan AthabascanAlbanianAleutAlsatianAmericanApacheArabArapahoArgentineanArmenianAssyrian/Chaldean/SyriacAustralianAustrianBahamianBangladeshiBarbadianBasqueBelgianBelizeanBermudanBhutaneseBlackfeetBolivianBrazilianBritishBritish West IndianBulgarianBurmeseCajunCambodianCanadianCape VerdeanCarpatho RusynCelticCentral AmericanCentral American IndianCherokeeCheyenneChickasawChileanChineseChippewaChoctawColombianColvilleComancheCosta RicanCreeCreekCroatianCrowCubanCypriotCzechCzechoslovakianDanishDelawareDominicanDutchDutch West IndianEastern EuropeanEcuadorianEgyptianEnglishEstonianEthiopianEuropeanFijianFilipinoFinnishFrenchFrench American IndianFrench CanadianGermanGerman RussianGhanaianGreekGuamanian/ChamorroGuatemalanGuyaneseHaitianHmongHonduranHopiHoumaHungarianIcelanderIndian (Asian)IndonesianInupiatIranianIraqiIrishIroquoisIsraeliItalianJamaicanJapaneseJordanianKenyanKiowaKoreanLaotianLatvianLebaneseLiberianLithuanianLumbeeLuxembourgerMacedonianMalaysianMalteseMarshalleseMenomineeMexicanMexican American IndianMongolianMoroccanNative HawaiianNavajoNepaleseNew ZealanderNicaraguanNigerianNorthern EuropeanNorwegianOkinawanOsageOttawaPaiutePakistaniPalestinianPanamanianParaguayanPennsylvania GermanPeruvianPimaPolishPortuguesePotawatomiPuebloPuerto RicanPuget Sound SalishRomanianRussianSalvadoranSamoanScandinavianScotch-IrishScottishSeminoleSenegaleseSerbianShoshoneSierra LeoneanSiouxSlavicSlovakSloveneSomaliSouth AfricanSouth AmericanSouth American IndianSoviet UnionSpaniardSpanishSpanish AmericanSpanish American IndianSri LankanSubsaharan AfricanSudaneseSwedishSwissSyrianTaiwaneseThaiTlingit-HaidaTohono O'OdhamTonganTrinidadian and TobagonianTsimshianTurkishU.S. Virgin IslanderUgandanUkrainianUruguayanUteVenezuelanVietnameseWelshWest IndianYakamaYaquiYugoslavianYumanYup'ikZimbabwean
Immigration
NonimmigrantsImmigrantsAfghanistanAfricaAlbaniaArgentinaArmeniaAsiaAustraliaAustriaBahamasBangladeshBarbadosBelarusBelgiumBelizeBoliviaBosnia and HerzegovinaBrazilBulgariaBurma/MyanmarCabo VerdeCambodiaCameroonCanadaCaribbeanCentral AmericaChileChinaColombiaCongoCosta RicaCroatiaCubaCzechoslovakiaDenmarkDominicaDominican RepublicEastern AfricaEastern EuropeEcuadorEgyptEl SalvadorEnglandEritreaEthiopiaEuropeFijiFranceGermanyGhanaGreeceGrenadaGuatemalaGuyanaHaitiHondurasHong KongHungaryIndiaIndonesiaIranIraqIrelandIsraelItalyJamaicaJapanJordanKazakhstanKenyaKoreaKuwaitLaosLatin AmericaLatviaLebanonLiberiaLithuaniaMalaysiaMexicoMicronesiaMiddle AfricaMoldovaMoroccoNepalNetherlandsNicaraguaNigeriaNorth AmericaNorth MacedoniaNorthern AfricaNorthern EuropeNorwayOceaniaPakistanPanamaPeruPhilippinesPolandPortugalRomaniaRussiaSaudi ArabiaScotlandSenegalSerbiaSierra LeoneSingaporeSomaliaSouth AfricaSouth AmericaSouth Central AsiaSouth Eastern AsiaSouthern EuropeSpainSri LankaSt. Vincent and the GrenadinesSudanSwedenSwitzerlandSyriaTaiwanThailandTrinidad and TobagoTurkeyUgandaUkraineUruguayUzbekistanVenezuelaVietnamWest IndiesWestern AfricaWestern AsiaWestern EuropeYemenZaireZimbabweAzores
Immigrants from Eastern Asia
Race
Ancestry
AfghanAfricanAlaska NativeAlaskan AthabascanAlbanianAleutAlsatianAmericanApacheArabArapahoArgentineanArmenianAssyrian/Chaldean/SyriacAustralianAustrianBahamianBangladeshiBarbadianBasqueBelgianBelizeanBermudanBhutaneseBlackfeetBolivianBrazilianBritishBritish West IndianBulgarianBurmeseCajunCambodianCanadianCape VerdeanCarpatho RusynCelticCentral AmericanCentral American IndianCherokeeCheyenneChickasawChileanChineseChippewaChoctawColombianColvilleComancheCosta RicanCreeCreekCroatianCrowCubanCypriotCzechCzechoslovakianDanishDelawareDominicanDutchDutch West IndianEastern EuropeanEcuadorianEgyptianEnglishEstonianEthiopianEuropeanFijianFilipinoFinnishFrenchFrench American IndianFrench CanadianGermanGerman RussianGhanaianGreekGuamanian/ChamorroGuatemalanGuyaneseHaitianHmongHonduranHopiHoumaHungarianIcelanderIndian (Asian)IndonesianInupiatIranianIraqiIrishIroquoisIsraeliItalianJamaicanJapaneseJordanianKenyanKiowaKoreanLaotianLatvianLiberianLithuanianLumbeeLuxembourgerMacedonianMalaysianMalteseMarshalleseMenomineeMexicanMexican American IndianMongolianMoroccanNative HawaiianNavajoNepaleseNew ZealanderNicaraguanNigerianNorthern EuropeanNorwegianOkinawanOsageOttawaPaiutePakistaniPalestinianPanamanianParaguayanPennsylvania GermanPeruvianPimaPolishPortuguesePotawatomiPuebloPuerto RicanPuget Sound SalishRomanianRussianSalvadoranSamoanScandinavianScotch-IrishScottishSeminoleSenegaleseSerbianShoshoneSierra LeoneanSiouxSlavicSlovakSloveneSomaliSouth AfricanSouth AmericanSouth American IndianSoviet UnionSpaniardSpanishSpanish AmericanSpanish American IndianSri LankanSubsaharan AfricanSudaneseSwedishSwissSyrianTaiwaneseThaiTlingit-HaidaTohono O'OdhamTonganTrinidadian and TobagonianTsimshianTurkishU.S. Virgin IslanderUgandanUkrainianUruguayanUteVenezuelanVietnameseWelshWest IndianYakamaYaquiYugoslavianYumanYup'ikZimbabwean
Immigration
NonimmigrantsImmigrantsAfghanistanAfricaAlbaniaArgentinaArmeniaAsiaAustraliaAustriaBahamasBangladeshBarbadosBelarusBelgiumBelizeBoliviaBosnia and HerzegovinaBrazilBulgariaBurma/MyanmarCabo VerdeCambodiaCameroonCanadaCaribbeanCentral AmericaChileChinaColombiaCongoCosta RicaCroatiaCubaCzechoslovakiaDenmarkDominicaDominican RepublicEastern AfricaEastern AsiaEastern EuropeEcuadorEgyptEl SalvadorEnglandEritreaEthiopiaEuropeFijiFranceGermanyGhanaGreeceGrenadaGuatemalaGuyanaHaitiHondurasHong KongHungaryIndiaIndonesiaIranIraqIrelandIsraelItalyJamaicaJapanJordanKazakhstanKenyaKoreaKuwaitLaosLatin AmericaLatviaLebanonLiberiaLithuaniaMalaysiaMexicoMicronesiaMiddle AfricaMoldovaMoroccoNepalNetherlandsNicaraguaNigeriaNorth AmericaNorth MacedoniaNorthern AfricaNorthern EuropeNorwayOceaniaPakistanPanamaPeruPhilippinesPolandPortugalRomaniaRussiaSaudi ArabiaScotlandSenegalSerbiaSierra LeoneSingaporeSomaliaSouth AfricaSouth AmericaSouth Central AsiaSouth Eastern AsiaSouthern EuropeSpainSri LankaSt. Vincent and the GrenadinesSudanSwedenSwitzerlandSyriaTaiwanThailandTrinidad and TobagoTurkeyUgandaUkraineUruguayUzbekistanVenezuelaVietnamWest IndiesWestern AfricaWestern AsiaWestern EuropeYemenZaireZimbabweAzores
Kindergarten
Income
Poverty
Unemployment
Labor Participation
Family Structure
Vehicle Availability
Education Level
Disability

Kindergarten Comparison

Lebanese

Immigrants from Eastern Asia

Exceptional
Tragic
98.2%
KINDERGARTEN
93.5/ 100
METRIC RATING
126th/ 347
METRIC RANK
97.6%
KINDERGARTEN
1.7/ 100
METRIC RATING
238th/ 347
METRIC RANK

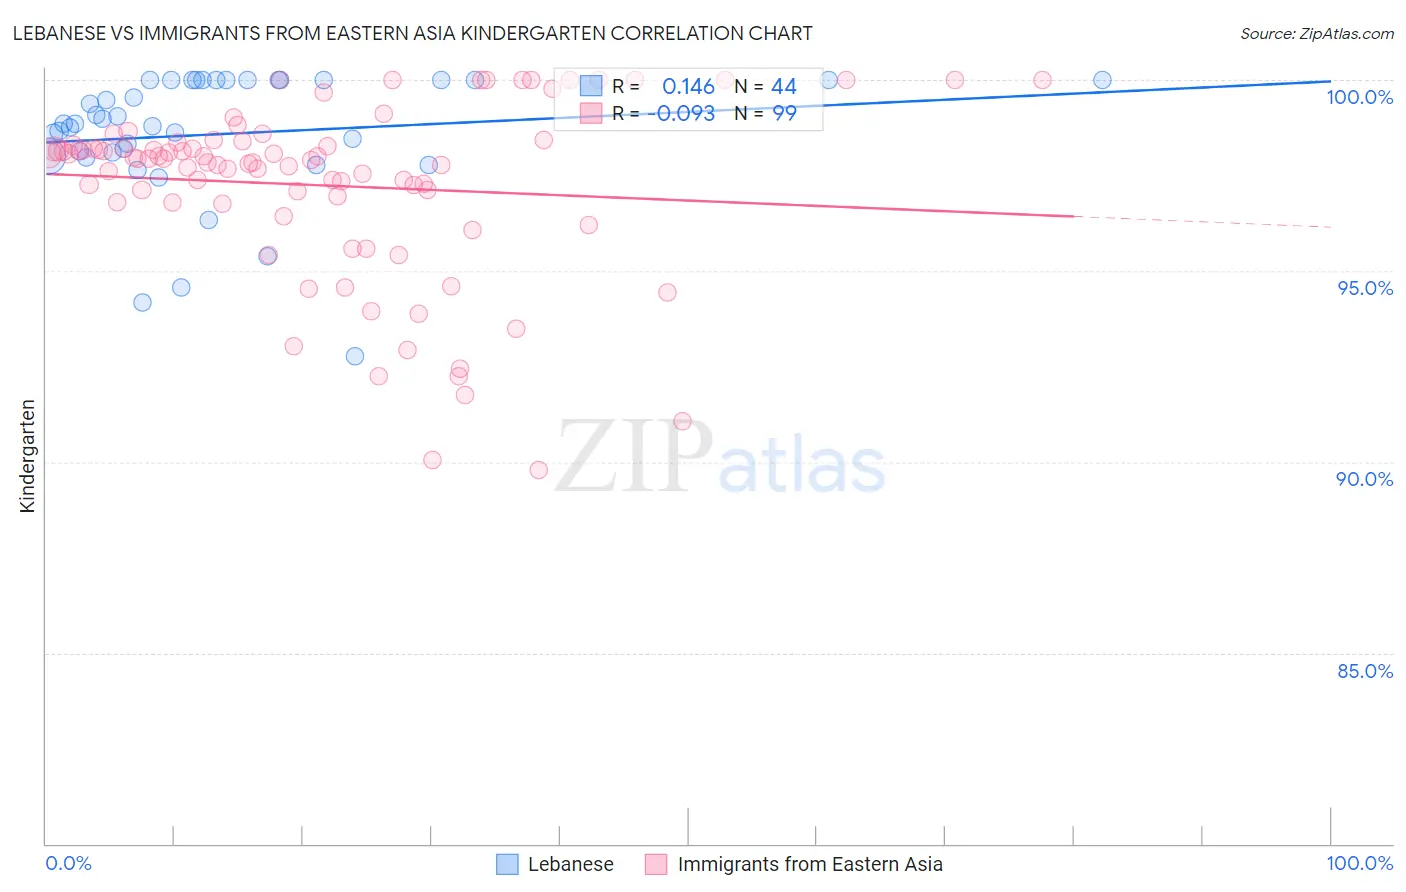
Lebanese vs Immigrants from Eastern Asia Kindergarten Correlation Chart

The statistical analysis conducted on geographies consisting of 401,624,157 people shows a poor positive correlation between the proportion of Lebanese and percentage of population with at least kindergarten education in the United States with a correlation coefficient (R) of 0.146 and weighted average of 98.2%. Similarly, the statistical analysis conducted on geographies consisting of 499,865,893 people shows a slight negative correlation between the proportion of Immigrants from Eastern Asia and percentage of population with at least kindergarten education in the United States with a correlation coefficient (R) of -0.093 and weighted average of 97.6%, a difference of 0.52%.
Lebanese vs Immigrants from Eastern Asia Kindergarten

Kindergarten Correlation Summary

MeasurementLebaneseImmigrants from Eastern Asia
Minimum92.8%89.8%
Maximum100.0%100.0%
Range7.2%10.2%
Mean98.6%97.2%
Median98.9%97.9%
Interquartile 25% (IQ1)98.1%96.8%
Interquartile 75% (IQ3)100.0%98.4%
Interquartile Range (IQR)1.9%1.6%
Standard Deviation (Sample)1.7%2.3%
Standard Deviation (Population)1.7%2.3%

Similar Demographics by Kindergarten

Demographics Similar to Lebanese by Kindergarten

In terms of kindergarten, the demographic groups most similar to Lebanese are Syrian (98.2%, a difference of 0.0%), Iroquois (98.2%, a difference of 0.0%), Immigrants from Saudi Arabia (98.1%, a difference of 0.0%), Okinawan (98.2%, a difference of 0.010%), and Immigrants from Zimbabwe (98.2%, a difference of 0.010%).
DemographicsRating | RankKindergarten
Thais
94.8
/100
|
#119
Exceptional
98.2%
Okinawans
94.4
/100
|
#120
Exceptional
98.2%
Immigrants | Zimbabwe
94.0
/100
|
#121
Exceptional
98.2%
Immigrants | Japan
94.0
/100
|
#122
Exceptional
98.2%
Menominee
93.9
/100
|
#123
Exceptional
98.2%
Syrians
93.6
/100
|
#124
Exceptional
98.2%
Iroquois
93.5
/100
|
#125
Exceptional
98.2%
Lebanese
93.5
/100
|
#126
Exceptional
98.2%
Immigrants | Saudi Arabia
93.1
/100
|
#127
Exceptional
98.1%
Immigrants | Serbia
92.4
/100
|
#128
Exceptional
98.1%
Seminole
91.5
/100
|
#129
Exceptional
98.1%
Immigrants | Croatia
91.2
/100
|
#130
Exceptional
98.1%
Cambodians
91.2
/100
|
#131
Exceptional
98.1%
Spaniards
91.0
/100
|
#132
Exceptional
98.1%
Immigrants | Europe
90.4
/100
|
#133
Exceptional
98.1%

Demographics Similar to Immigrants from Eastern Asia by Kindergarten

In terms of kindergarten, the demographic groups most similar to Immigrants from Eastern Asia are Nigerian (97.6%, a difference of 0.0%), U.S. Virgin Islander (97.6%, a difference of 0.0%), Korean (97.6%, a difference of 0.010%), Immigrants from Pakistan (97.7%, a difference of 0.020%), and Immigrants from Malaysia (97.7%, a difference of 0.020%).
DemographicsRating | RankKindergarten
Puerto Ricans
2.7
/100
|
#231
Tragic
97.7%
Immigrants | Uruguay
2.6
/100
|
#232
Tragic
97.7%
Immigrants | Pakistan
2.2
/100
|
#233
Tragic
97.7%
Immigrants | Malaysia
2.2
/100
|
#234
Tragic
97.7%
Colombians
2.2
/100
|
#235
Tragic
97.7%
Immigrants | Western Asia
2.1
/100
|
#236
Tragic
97.7%
Nigerians
1.8
/100
|
#237
Tragic
97.6%
Immigrants | Eastern Asia
1.7
/100
|
#238
Tragic
97.6%
U.S. Virgin Islanders
1.7
/100
|
#239
Tragic
97.6%
Koreans
1.6
/100
|
#240
Tragic
97.6%
Liberians
1.3
/100
|
#241
Tragic
97.6%
Immigrants | Indonesia
1.3
/100
|
#242
Tragic
97.6%
Asians
1.2
/100
|
#243
Tragic
97.6%
Bolivians
1.2
/100
|
#244
Tragic
97.6%
South Americans
1.1
/100
|
#245
Tragic
97.6%