Latvian vs Immigrants from Singapore Bachelor's Degree

COMPARE

Latvian
Race
Ancestry
AfghanAfricanAlaska NativeAlaskan AthabascanAlbanianAleutAlsatianAmericanApacheArabArapahoArgentineanArmenianAssyrian/Chaldean/SyriacAustralianAustrianBahamianBangladeshiBarbadianBasqueBelgianBelizeanBermudanBhutaneseBlackfeetBolivianBrazilianBritishBritish West IndianBulgarianBurmeseCajunCambodianCanadianCape VerdeanCarpatho RusynCelticCentral AmericanCentral American IndianCherokeeCheyenneChickasawChileanChineseChippewaChoctawColombianColvilleComancheCosta RicanCreeCreekCroatianCrowCubanCypriotCzechCzechoslovakianDanishDelawareDominicanDutchDutch West IndianEastern EuropeanEcuadorianEgyptianEnglishEstonianEthiopianEuropeanFijianFilipinoFinnishFrenchFrench American IndianFrench CanadianGermanGerman RussianGhanaianGreekGuamanian/ChamorroGuatemalanGuyaneseHaitianHmongHonduranHopiHoumaHungarianIcelanderIndian (Asian)IndonesianInupiatIranianIraqiIrishIroquoisIsraeliItalianJamaicanJapaneseJordanianKenyanKiowaKoreanLaotianLatvianLebaneseLiberianLithuanianLumbeeLuxembourgerMacedonianMalaysianMalteseMarshalleseMenomineeMexicanMexican American IndianMongolianMoroccanNative HawaiianNavajoNepaleseNew ZealanderNicaraguanNigerianNorthern EuropeanNorwegianOkinawanOsageOttawaPaiutePakistaniPalestinianPanamanianParaguayanPennsylvania GermanPeruvianPimaPolishPortuguesePotawatomiPuebloPuerto RicanPuget Sound SalishRomanianRussianSalvadoranSamoanScandinavianScotch-IrishScottishSeminoleSenegaleseSerbianShoshoneSierra LeoneanSiouxSlavicSlovakSloveneSomaliSouth AfricanSouth AmericanSouth American IndianSoviet UnionSpaniardSpanishSpanish AmericanSpanish American IndianSri LankanSubsaharan AfricanSudaneseSwedishSwissSyrianTaiwaneseThaiTlingit-HaidaTohono O'OdhamTonganTrinidadian and TobagonianTsimshianTurkishU.S. Virgin IslanderUgandanUkrainianUruguayanUteVenezuelanVietnameseWelshWest IndianYakamaYaquiYugoslavianYumanYup'ikZimbabwean
Immigration
NonimmigrantsImmigrantsAfghanistanAfricaAlbaniaArgentinaArmeniaAsiaAustraliaAustriaBahamasBangladeshBarbadosBelarusBelgiumBelizeBoliviaBosnia and HerzegovinaBrazilBulgariaBurma/MyanmarCabo VerdeCambodiaCameroonCanadaCaribbeanCentral AmericaChileChinaColombiaCongoCosta RicaCroatiaCubaCzechoslovakiaDenmarkDominicaDominican RepublicEastern AfricaEastern AsiaEastern EuropeEcuadorEgyptEl SalvadorEnglandEritreaEthiopiaEuropeFijiFranceGermanyGhanaGreeceGrenadaGuatemalaGuyanaHaitiHondurasHong KongHungaryIndiaIndonesiaIranIraqIrelandIsraelItalyJamaicaJapanJordanKazakhstanKenyaKoreaKuwaitLaosLatin AmericaLatviaLebanonLiberiaLithuaniaMalaysiaMexicoMicronesiaMiddle AfricaMoldovaMoroccoNepalNetherlandsNicaraguaNigeriaNorth AmericaNorth MacedoniaNorthern AfricaNorthern EuropeNorwayOceaniaPakistanPanamaPeruPhilippinesPolandPortugalRomaniaRussiaSaudi ArabiaScotlandSenegalSerbiaSierra LeoneSomaliaSouth AfricaSouth AmericaSouth Central AsiaSouth Eastern AsiaSouthern EuropeSpainSri LankaSt. Vincent and the GrenadinesSudanSwedenSwitzerlandSyriaTaiwanThailandTrinidad and TobagoTurkeyUgandaUkraineUruguayUzbekistanVenezuelaVietnamWest IndiesWestern AfricaWestern AsiaWestern EuropeYemenZaireZimbabweAzores
Immigrants from Singapore
Race
Ancestry
AfghanAfricanAlaska NativeAlaskan AthabascanAlbanianAleutAlsatianAmericanApacheArabArapahoArgentineanArmenianAssyrian/Chaldean/SyriacAustralianAustrianBahamianBangladeshiBarbadianBasqueBelgianBelizeanBermudanBhutaneseBlackfeetBolivianBrazilianBritishBritish West IndianBulgarianBurmeseCajunCambodianCanadianCape VerdeanCarpatho RusynCelticCentral AmericanCentral American IndianCherokeeCheyenneChickasawChileanChineseChippewaChoctawColombianColvilleComancheCosta RicanCreeCreekCroatianCrowCubanCypriotCzechCzechoslovakianDanishDelawareDominicanDutchDutch West IndianEastern EuropeanEcuadorianEgyptianEnglishEstonianEthiopianEuropeanFijianFilipinoFinnishFrenchFrench American IndianFrench CanadianGermanGerman RussianGhanaianGreekGuamanian/ChamorroGuatemalanGuyaneseHaitianHmongHonduranHopiHoumaHungarianIcelanderIndian (Asian)IndonesianInupiatIranianIraqiIrishIroquoisIsraeliItalianJamaicanJapaneseJordanianKenyanKiowaKoreanLaotianLebaneseLiberianLithuanianLumbeeLuxembourgerMacedonianMalaysianMalteseMarshalleseMenomineeMexicanMexican American IndianMongolianMoroccanNative HawaiianNavajoNepaleseNew ZealanderNicaraguanNigerianNorthern EuropeanNorwegianOkinawanOsageOttawaPaiutePakistaniPalestinianPanamanianParaguayanPennsylvania GermanPeruvianPimaPolishPortuguesePotawatomiPuebloPuerto RicanPuget Sound SalishRomanianRussianSalvadoranSamoanScandinavianScotch-IrishScottishSeminoleSenegaleseSerbianShoshoneSierra LeoneanSiouxSlavicSlovakSloveneSomaliSouth AfricanSouth AmericanSouth American IndianSoviet UnionSpaniardSpanishSpanish AmericanSpanish American IndianSri LankanSubsaharan AfricanSudaneseSwedishSwissSyrianTaiwaneseThaiTlingit-HaidaTohono O'OdhamTonganTrinidadian and TobagonianTsimshianTurkishU.S. Virgin IslanderUgandanUkrainianUruguayanUteVenezuelanVietnameseWelshWest IndianYakamaYaquiYugoslavianYumanYup'ikZimbabwean
Immigration
NonimmigrantsImmigrantsAfghanistanAfricaAlbaniaArgentinaArmeniaAsiaAustraliaAustriaBahamasBangladeshBarbadosBelarusBelgiumBelizeBoliviaBosnia and HerzegovinaBrazilBulgariaBurma/MyanmarCabo VerdeCambodiaCameroonCanadaCaribbeanCentral AmericaChileChinaColombiaCongoCosta RicaCroatiaCubaCzechoslovakiaDenmarkDominicaDominican RepublicEastern AfricaEastern AsiaEastern EuropeEcuadorEgyptEl SalvadorEnglandEritreaEthiopiaEuropeFijiFranceGermanyGhanaGreeceGrenadaGuatemalaGuyanaHaitiHondurasHong KongHungaryIndiaIndonesiaIranIraqIrelandIsraelItalyJamaicaJapanJordanKazakhstanKenyaKoreaKuwaitLaosLatin AmericaLatviaLebanonLiberiaLithuaniaMalaysiaMexicoMicronesiaMiddle AfricaMoldovaMoroccoNepalNetherlandsNicaraguaNigeriaNorth AmericaNorth MacedoniaNorthern AfricaNorthern EuropeNorwayOceaniaPakistanPanamaPeruPhilippinesPolandPortugalRomaniaRussiaSaudi ArabiaScotlandSenegalSerbiaSierra LeoneSingaporeSomaliaSouth AfricaSouth AmericaSouth Central AsiaSouth Eastern AsiaSouthern EuropeSpainSri LankaSt. Vincent and the GrenadinesSudanSwedenSwitzerlandSyriaTaiwanThailandTrinidad and TobagoTurkeyUgandaUkraineUruguayUzbekistanVenezuelaVietnamWest IndiesWestern AfricaWestern AsiaWestern EuropeYemenZaireZimbabweAzores
Bachelor's Degree
Income
Poverty
Unemployment
Labor Participation
Family Structure
Vehicle Availability
Education Level
Disability

Bachelor's Degree Comparison

Latvians

Immigrants from Singapore

Exceptional
Exceptional
46.1%
BACHELOR'S DEGREE
100.0/ 100
METRIC RATING
31st/ 347
METRIC RANK
51.9%
BACHELOR'S DEGREE
100.0/ 100
METRIC RATING
2nd/ 347
METRIC RANK

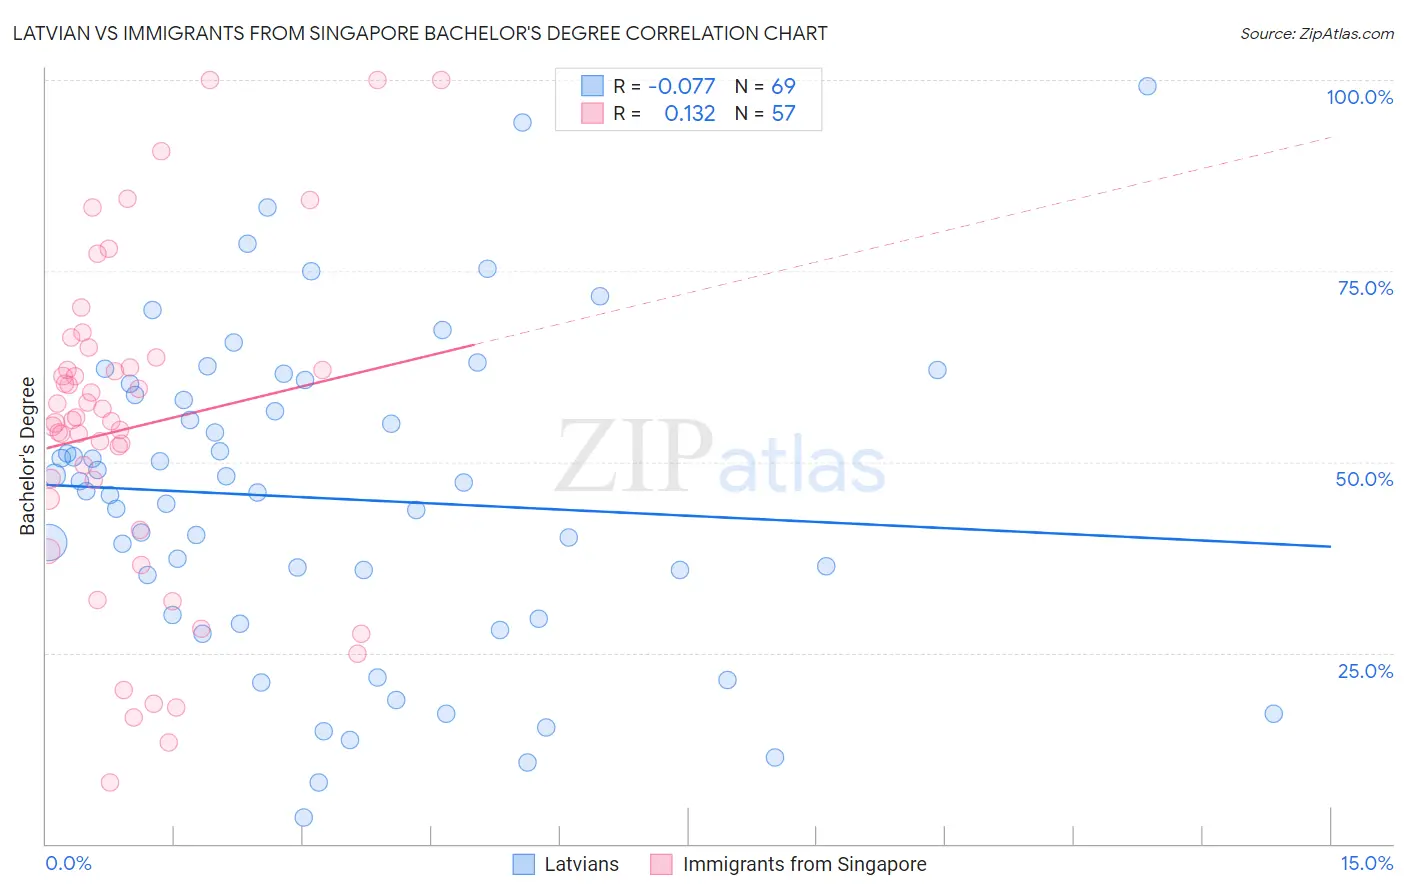
Latvian vs Immigrants from Singapore Bachelor's Degree Correlation Chart

The statistical analysis conducted on geographies consisting of 220,722,660 people shows a slight negative correlation between the proportion of Latvians and percentage of population with at least bachelor's degree education in the United States with a correlation coefficient (R) of -0.077 and weighted average of 46.1%. Similarly, the statistical analysis conducted on geographies consisting of 137,512,877 people shows a poor positive correlation between the proportion of Immigrants from Singapore and percentage of population with at least bachelor's degree education in the United States with a correlation coefficient (R) of 0.132 and weighted average of 51.9%, a difference of 12.7%.
Latvian vs Immigrants from Singapore Bachelor's Degree

Bachelor's Degree Correlation Summary

MeasurementLatvianImmigrants from Singapore
Minimum3.4%8.0%
Maximum99.2%100.0%
Range95.8%92.0%
Mean45.2%54.5%
Median46.1%55.5%
Interquartile 25% (IQ1)29.7%43.1%
Interquartile 75% (IQ3)59.5%63.0%
Interquartile Range (IQR)29.8%20.0%
Standard Deviation (Sample)20.7%21.5%
Standard Deviation (Population)20.5%21.3%

Similar Demographics by Bachelor's Degree

Demographics Similar to Latvians by Bachelor's Degree

In terms of bachelor's degree, the demographic groups most similar to Latvians are Immigrants from Sri Lanka (46.1%, a difference of 0.040%), Israeli (46.1%, a difference of 0.090%), Turkish (46.2%, a difference of 0.22%), Immigrants from Turkey (46.0%, a difference of 0.30%), and Immigrants from France (46.4%, a difference of 0.68%).
DemographicsRating | RankBachelor's Degree
Immigrants | Korea
100.0
/100
|
#24
Exceptional
47.0%
Burmese
100.0
/100
|
#25
Exceptional
46.9%
Immigrants | Japan
100.0
/100
|
#26
Exceptional
46.8%
Immigrants | France
100.0
/100
|
#27
Exceptional
46.4%
Turks
100.0
/100
|
#28
Exceptional
46.2%
Israelis
100.0
/100
|
#29
Exceptional
46.1%
Immigrants | Sri Lanka
100.0
/100
|
#30
Exceptional
46.1%
Latvians
100.0
/100
|
#31
Exceptional
46.1%
Immigrants | Turkey
100.0
/100
|
#32
Exceptional
46.0%
Immigrants | Northern Europe
100.0
/100
|
#33
Exceptional
45.6%
Immigrants | Denmark
100.0
/100
|
#34
Exceptional
45.4%
Immigrants | Russia
100.0
/100
|
#35
Exceptional
45.4%
Mongolians
100.0
/100
|
#36
Exceptional
45.4%
Russians
100.0
/100
|
#37
Exceptional
45.3%
Bulgarians
100.0
/100
|
#38
Exceptional
45.3%

Demographics Similar to Immigrants from Singapore by Bachelor's Degree

In terms of bachelor's degree, the demographic groups most similar to Immigrants from Singapore are Immigrants from India (51.3%, a difference of 1.2%), Immigrants from Taiwan (51.2%, a difference of 1.4%), Filipino (52.7%, a difference of 1.5%), Iranian (51.0%, a difference of 1.9%), and Okinawan (50.5%, a difference of 2.7%).
DemographicsRating | RankBachelor's Degree
Filipinos
100.0
/100
|
#1
Exceptional
52.7%
Immigrants | Singapore
100.0
/100
|
#2
Exceptional
51.9%
Immigrants | India
100.0
/100
|
#3
Exceptional
51.3%
Immigrants | Taiwan
100.0
/100
|
#4
Exceptional
51.2%
Iranians
100.0
/100
|
#5
Exceptional
51.0%
Okinawans
100.0
/100
|
#6
Exceptional
50.5%
Immigrants | Iran
100.0
/100
|
#7
Exceptional
50.3%
Thais
100.0
/100
|
#8
Exceptional
50.1%
Immigrants | Israel
100.0
/100
|
#9
Exceptional
50.0%
Cypriots
100.0
/100
|
#10
Exceptional
49.0%
Immigrants | Australia
100.0
/100
|
#11
Exceptional
48.5%
Immigrants | China
100.0
/100
|
#12
Exceptional
48.4%
Immigrants | South Central Asia
100.0
/100
|
#13
Exceptional
48.3%
Immigrants | Hong Kong
100.0
/100
|
#14
Exceptional
48.2%
Immigrants | Eastern Asia
100.0
/100
|
#15
Exceptional
48.1%