Latvian vs Immigrants from Dominica 6th Grade
COMPARE
Latvian
Immigrants from Dominica
6th Grade
6th Grade Comparison
Latvians
Immigrants from Dominica
97.9%
6TH GRADE
99.9/ 100
METRIC RATING
40th/ 347
METRIC RANK
95.7%
6TH GRADE
0.0/ 100
METRIC RATING
300th/ 347
METRIC RANK
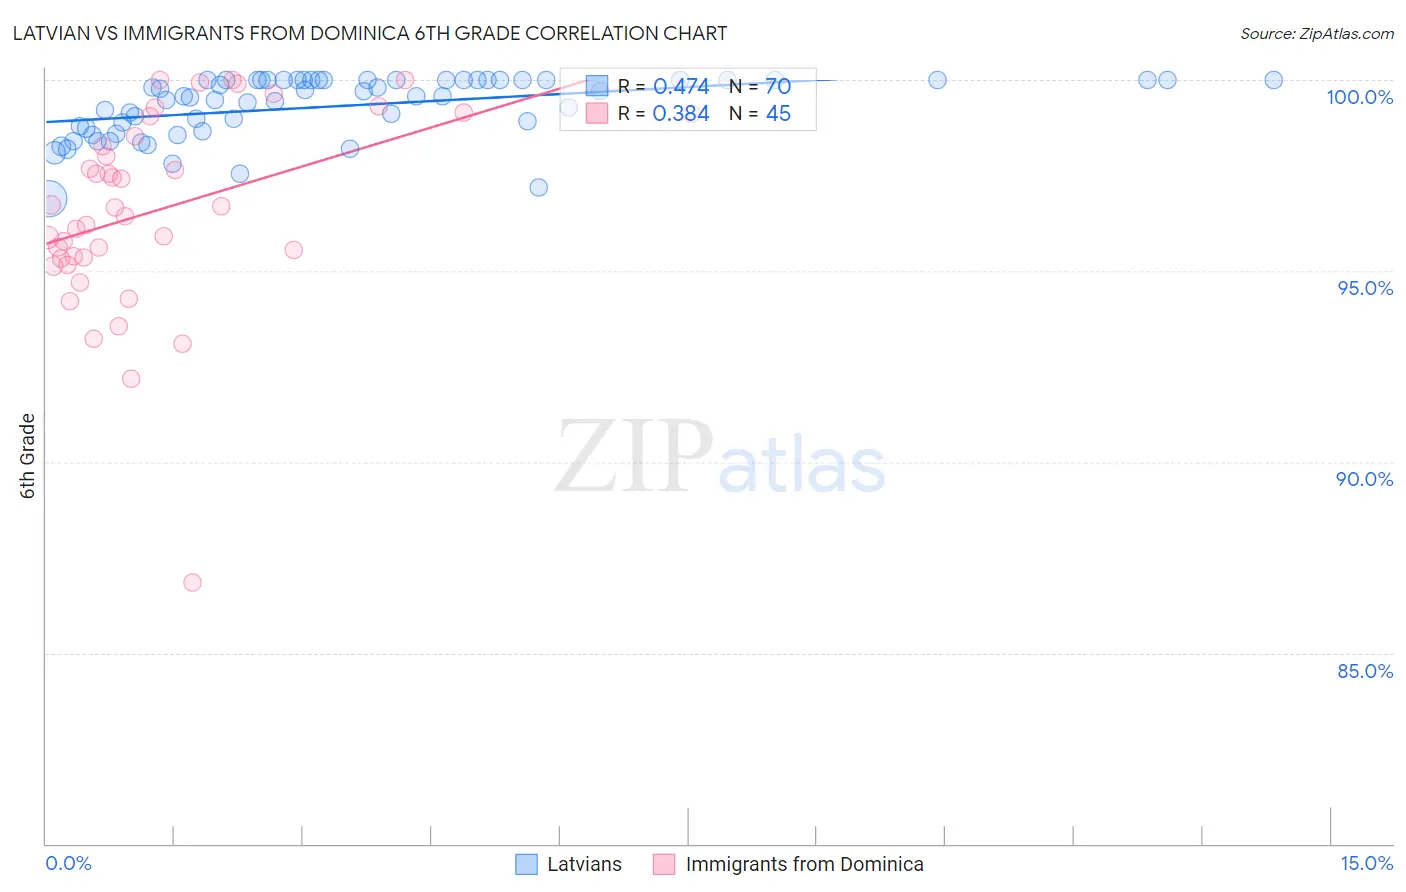
Latvian vs Immigrants from Dominica 6th Grade Correlation Chart
The statistical analysis conducted on geographies consisting of 220,726,452 people shows a moderate positive correlation between the proportion of Latvians and percentage of population with at least 6th grade education in the United States with a correlation coefficient (R) of 0.474 and weighted average of 97.9%. Similarly, the statistical analysis conducted on geographies consisting of 83,794,115 people shows a mild positive correlation between the proportion of Immigrants from Dominica and percentage of population with at least 6th grade education in the United States with a correlation coefficient (R) of 0.384 and weighted average of 95.7%, a difference of 2.2%.
6th Grade Correlation Summary
| Measurement | Latvian | Immigrants from Dominica |
| Minimum | 96.9% | 86.8% |
| Maximum | 100.0% | 100.0% |
| Range | 3.1% | 13.2% |
| Mean | 99.3% | 96.6% |
| Median | 99.6% | 96.7% |
| Interquartile 25% (IQ1) | 98.7% | 95.3% |
| Interquartile 75% (IQ3) | 100.0% | 98.8% |
| Interquartile Range (IQR) | 1.3% | 3.5% |
| Standard Deviation (Sample) | 0.79% | 2.6% |
| Standard Deviation (Population) | 0.79% | 2.5% |
Similar Demographics by 6th Grade
Demographics Similar to Latvians by 6th Grade
In terms of 6th grade, the demographic groups most similar to Latvians are Belgian (97.9%, a difference of 0.010%), Luxembourger (97.9%, a difference of 0.010%), British (97.9%, a difference of 0.030%), Eastern European (97.9%, a difference of 0.030%), and Chinese (97.9%, a difference of 0.040%).
| Demographics | Rating | Rank | 6th Grade |
| Chippewa | 100.0 /100 | #33 | Exceptional 97.9% |
| Swiss | 100.0 /100 | #34 | Exceptional 97.9% |
| Chinese | 100.0 /100 | #35 | Exceptional 97.9% |
| Italians | 100.0 /100 | #36 | Exceptional 97.9% |
| British | 100.0 /100 | #37 | Exceptional 97.9% |
| Belgians | 100.0 /100 | #38 | Exceptional 97.9% |
| Luxembourgers | 99.9 /100 | #39 | Exceptional 97.9% |
| Latvians | 99.9 /100 | #40 | Exceptional 97.9% |
| Eastern Europeans | 99.9 /100 | #41 | Exceptional 97.9% |
| Hungarians | 99.9 /100 | #42 | Exceptional 97.8% |
| Northern Europeans | 99.9 /100 | #43 | Exceptional 97.8% |
| Czechoslovakians | 99.9 /100 | #44 | Exceptional 97.8% |
| Bulgarians | 99.9 /100 | #45 | Exceptional 97.8% |
| Arapaho | 99.9 /100 | #46 | Exceptional 97.8% |
| Native Hawaiians | 99.9 /100 | #47 | Exceptional 97.8% |
Demographics Similar to Immigrants from Dominica by 6th Grade
In terms of 6th grade, the demographic groups most similar to Immigrants from Dominica are Immigrants from Laos (95.7%, a difference of 0.010%), Immigrants (95.7%, a difference of 0.010%), Immigrants from Burma/Myanmar (95.7%, a difference of 0.020%), Sri Lankan (95.8%, a difference of 0.030%), and Haitian (95.8%, a difference of 0.090%).
| Demographics | Rating | Rank | 6th Grade |
| Immigrants | West Indies | 0.0 /100 | #293 | Tragic 96.1% |
| British West Indians | 0.0 /100 | #294 | Tragic 96.0% |
| Immigrants | Grenada | 0.0 /100 | #295 | Tragic 95.9% |
| Immigrants | South Eastern Asia | 0.0 /100 | #296 | Tragic 95.9% |
| Haitians | 0.0 /100 | #297 | Tragic 95.8% |
| Sri Lankans | 0.0 /100 | #298 | Tragic 95.8% |
| Immigrants | Laos | 0.0 /100 | #299 | Tragic 95.7% |
| Immigrants | Dominica | 0.0 /100 | #300 | Tragic 95.7% |
| Immigrants | Immigrants | 0.0 /100 | #301 | Tragic 95.7% |
| Immigrants | Burma/Myanmar | 0.0 /100 | #302 | Tragic 95.7% |
| Bangladeshis | 0.0 /100 | #303 | Tragic 95.7% |
| Indonesians | 0.0 /100 | #304 | Tragic 95.6% |
| Immigrants | Cuba | 0.0 /100 | #305 | Tragic 95.6% |
| Immigrants | Haiti | 0.0 /100 | #306 | Tragic 95.6% |
| Guyanese | 0.0 /100 | #307 | Tragic 95.6% |